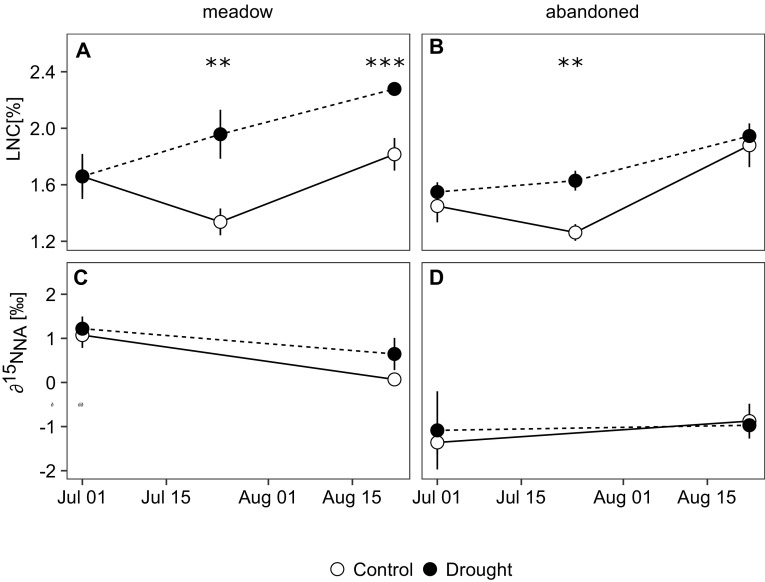
Figure 4.
A, B Leaf nitrogen concentrations (LNC) and C, D corresponding natural abundance δ15N isotope values of leaves in monoliths from the meadow and the abandoned grassland subjected to ambient conditions (open symbols) and drought (closed symbols) and sampled at peak drought (1 July) and during recovery (24 July, 22 August). Error bars indicate standard errors of the mean (n = 3 for July and n = 4 for August samplings), stars indicate significant treatment effects within land use and sampling date (p value: *** < 0.001 < ** < 0.01 < * < 0.05).

