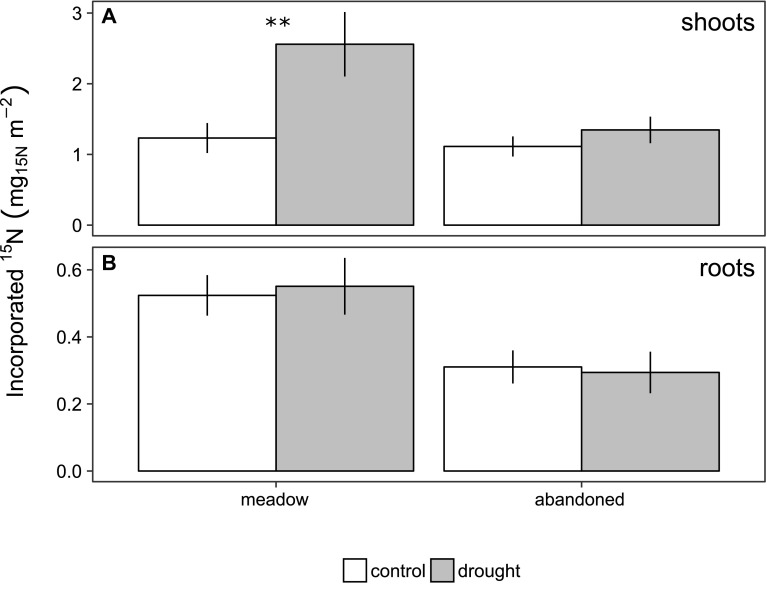
Figure 5.
Amount of 15N label recovered in the two grasslands in A shoots and B roots of control monoliths (open bars) and in monoliths recovering from drought (shaded bars) 3 weeks after the rewetting. Error bars indicate standard errors of the mean (n = 3). Stars indicate significant differences between control and drought treatment (p value: ** < 0.01).

