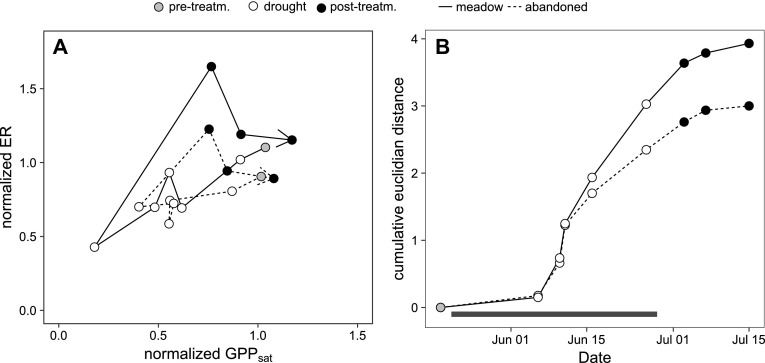
Figure 8.
A The course of normalized light-saturated rates of gross primary productivity (GPPsat) and ecosystem respiration (ER) before (grey points), during (open points) and after (black points) the drought experiment in the meadow (solid line) and the abandoned grassland (dotted line). Normalized fluxes were calculated as the ratio of the flux in drought monoliths to the respective flux in control monoliths. The direction of the path is given by the arrow, symbols denote the periods before (shaded), during (open) and after (closed) drought. B Cumulative Euclidian distance of the response trajectories of the two grasslands over the course of the drought. The Euclidian distance between two consecutive measurements days is a measure of the system’s change in the bivariate flux space. The cumulative Euclidian distance from beginning of the drought (pretreatment) is a measure of the overall perturbation of the grassland. The black horizontal bar indicates period of rain exclusion.

