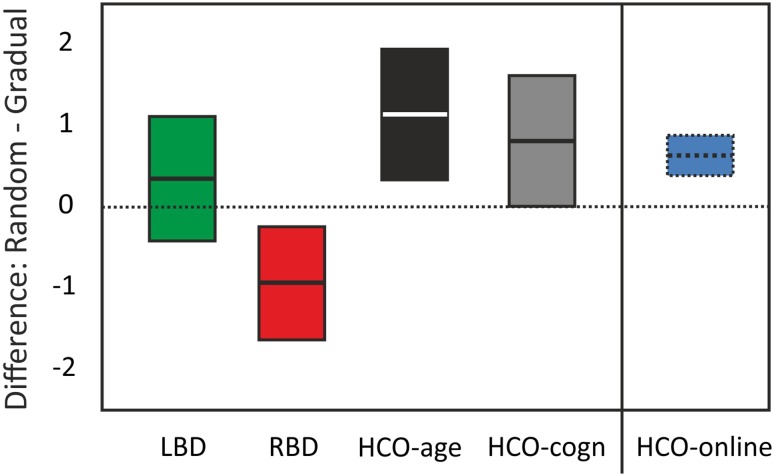
Fig. 5.
Average (95% CI) difference scores (random–gradual) for LBD (green), RBD (red), HCO-age-matched and HCO-cognitively-matched (gray). Results of healthy young participants from the online study are included for comparison purposes (blue) (for interpretation of the references to color in this figure legend, the reader is referred to the web version of this article)

