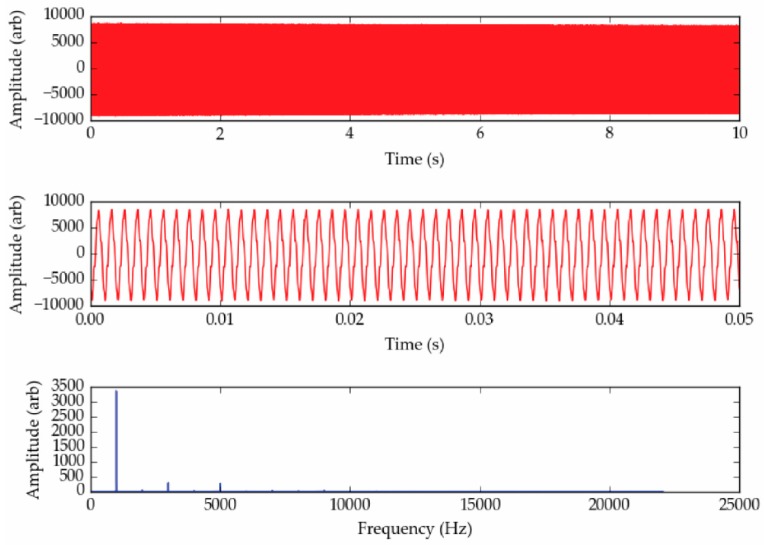
Figure 3.
Example data showing the sensor response to a 1000 Hz signal using an acoustic sensing yarn. (Top) The raw collected signal. (Middle) A graph of the raw signal covering a shorter time interval, showing the waveform. (Bottom) The fast-Fourier transform of the signal. In this example, there are some higher frequency spectral features, however the main signal is seen as a 1000 Hz.

