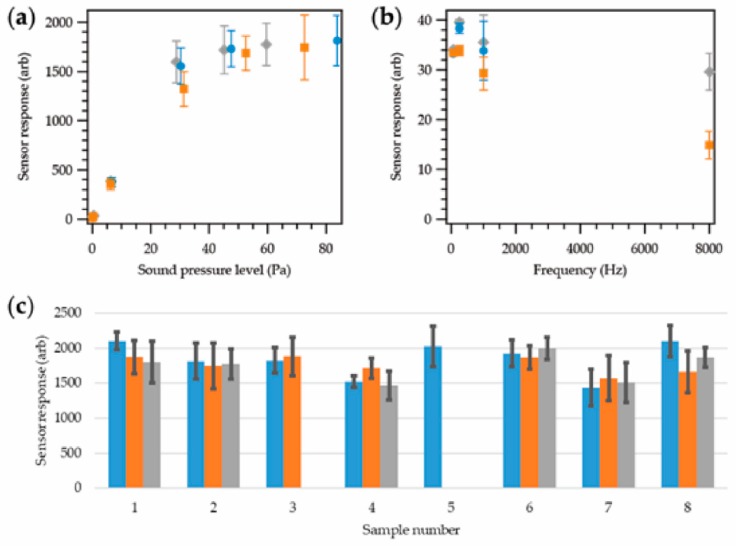
Figure 4.
Sensor response for microphones at different stages of encapsulation; soldered to copper interconnects (blue;  ), resin encapsulation (orange;
  ), final yarn (grey;
  ). All data points were the average of five repeat measurements. (a) Sensor response as a function of sound pressure level at a fixed frequency of 1000 Hz. Tests were carried out between 0.1 and 81.2 Pa (74.8–132.2 dB), with the sensor operating correctly at all amplitudes across this range. (b) Sensor response as a function of frequency at a fixed sound pressure level of 0.43 ± 0.02 Pa. Note that the soldered microphone was not able to detect signals at 8000 Hz correctly. (c) Sensor response for eight different microphones at different stages of encapsulation. The input sound had an amplitude of 69.2 ± 9.6 Pa with a 1000 Hz frequency. Note that the large variation in the sound pressure level did not matter in this case, as this level was well above the linear range of the sensor (Figure 4a). Within the experimental error, the sensor response appeared to be unaffected by the encapsulation process.

