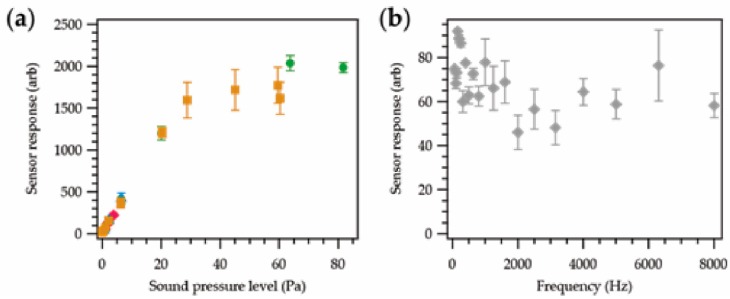
Figure 5.
Sensor response for an acoustic sensing yarn. All data points were the average of five repeat measurements. (a) Sensor response as a function of sound pressure level at four frequencies, 125 Hz (green;  ), 1000 Hz (yellow;
  ), 4000 Hz (blue;
  ), and 8000 Hz (pink;
  ). Tests were carried out between 0.02 and 82 Pa, and gave similar responses regardless of frequency. It should be noted that higher SPLs were not possible for all frequencies explored, given the limitations of the testing apparatus. (b) Sensor response as a function of frequency at a fixed sound pressure level of 1.03 ± 0.05 Pa.

