
Figure 2. Flotillin-1, but not caveolin-1, participates in endocytosis and lysosomal targeting of syndecan-1 with its multivalent ligands.
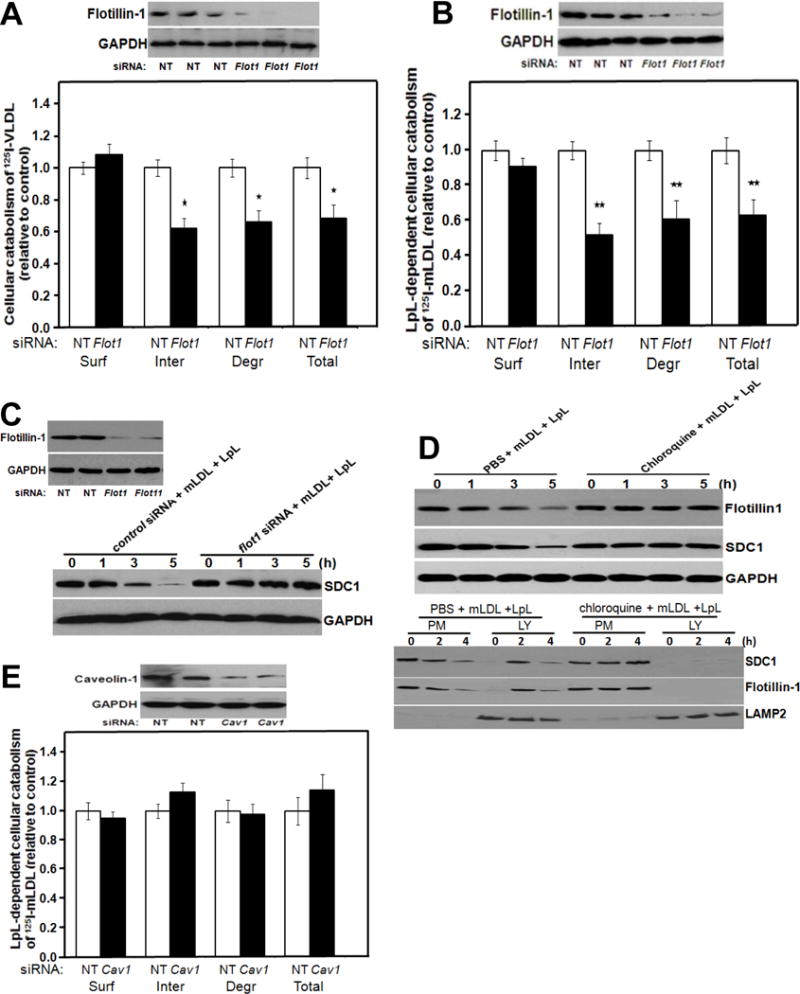
Panels A, B: Participation of flotillin-1 in syndecan-1-mediated catabolism of VLDL and model remnant lipoproteins. McArdle hepatocytes were incubated at 37°C for 4 hours with 100 nM nontarget (NT) control siRNA or Flot1 siRNA, as indicated. Cells were rinsed to remove unincorporated siRNA, and then incubated at 37°C in serum-containing medium for an additional 44 hours. Cells were switched to serum-free medium and incubated at 37°C for 4 hours with labeled lipoproteins. The upper images in Panels A, B show immunoblots of whole-cell homogenates, and the column graphs display values for cell-surface binding (Surf), internalization (Inter, calculated as the sum of intracellular accumulation plus degradation), degradation (Degr), and total cellular catabolism (Total, calculated as surface binding plus internalization) of the labeled lipoproteins, normalized to control values from cells treated with the nontarget siRNA (mean ± SEM, n=3). Panel A: Cellular catabolism of 125I-labelled human VLDL; nonnormalized control values were 117± 4.1, 421 ± 10.2, 219 ± 6.5, and total 539 ± 16.2 ng/mg, respectively. *p<0.05 between nontarget control and flotillin-1 knock-down (two-tailed Student’s t-test). Panel B: LpL-dependent cellular catabolism of LpL-enriched 125I-labelled mLDL; nonnormalized control values were 156 ± 4.2, 301 ± 8.6, 110 ± 3.1, and total 457 ± 10.6 ng/mg, respectively. **p<0.01 between nontarget control and flotillin-1 knock-down (two-tailed Student’s t-test). Panel C: Participation of flotillin-1 in the loss of cellular syndecan-1 during ligand catabolism. McArdle hepatocytes were treated with nontarget and Flot1 siRNAs as in Panels A, B and then LpL-enriched mLDL was added at the indicated times before harvest. Displayed are immunoblots of whole-cell homogenates to detect flotillin-1 at t=0h to verify the knock-down (left) and then syndecan-1 during the time course from 0 to 5h (SDC1; right). The protein GAPDH was used as a loading control. Panel D: Lysosomal targeting of flotillin-1 with syndecan-1 during catabolism of model remnant lipoproteins. McArdle hepatocytes were treated with PBS or chloroquine, as indicated, and then incubated at 37°C for the indicated times with unlabeled model remnant lipoproteins (LpL-enriched mLDL). The upper three immunoblots were performed to detect flotillin-1, syndecan-1 (SDC1), and, as a loading control, GAPDH in whole-cell homogenates. The lower three immunoblots show the contents of syndecan-1, flotillin-1, and LAMP2 (a lysosomal marker) in plasma membrane (PM) and lysosomal (LY) fractions that we isolated from these hepatocytes, as described in the Methods. Panel E: No detectable role for caveolin-1 in syndecan-1-mediated catabolism of model remnant lipoproteins. McArdle hepatocytes were treated exactly as in Panel B, except that the target siRNA was directed against caveolin-1 (Cav1) and, accordingly, the immunoblot verified caveolin-1 knock-down. Nonnormalized control values for surface binding, internalization, degradation, and total cellular catabolism of LpL-enriched 125I-labeled mLDL were 224 ± 6.2, 457 ± 10.6, 217 ± 4.1, and total 681 ± 15.2 ng/mg, respectively (mean ± SEM, n=3). p﹥0.5 between nontarget control and caveolin-1 knock-down for each of the four catabolic parameters (two-tailed Student’s t-test). All data in this figure are representatives of three independent experiments.