
Figure 3. Type 2 diabetes in KKAy mice suppresses hepatic levels of flotillin-1 in association with hypertriglyceridemia.
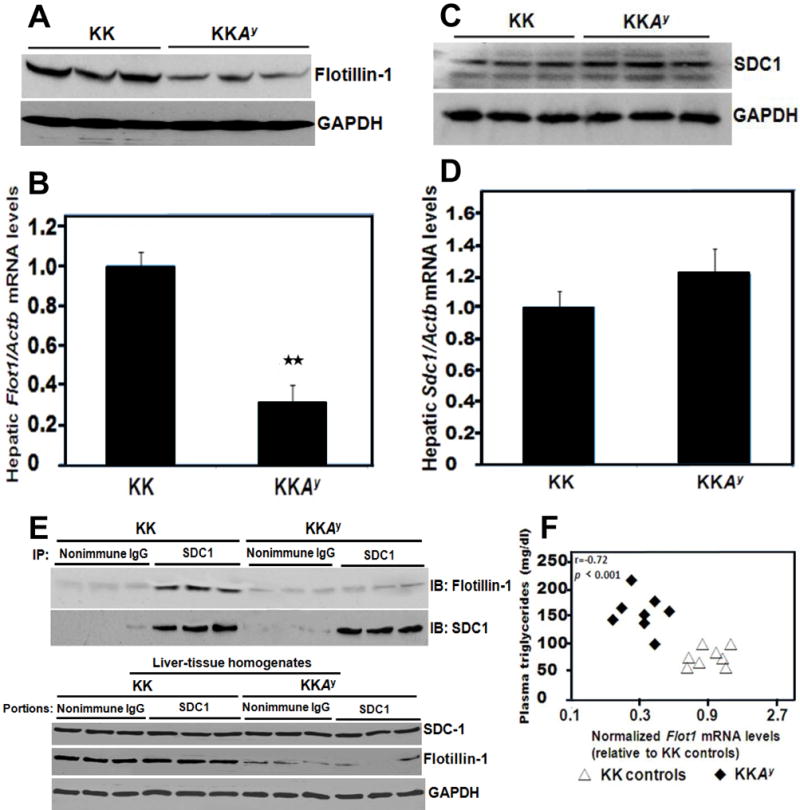
Protein and RNA were extracted from liver tissues of 12-week-old phenotypically lean KK mice (controls) and their hyperphagic, centrally obese, T2DM KKAy littermates. Panel A: Immunoblots in triplicate for hepatic flotillin-1 protein and, as a loading control, GAPDH. Each lane represents a sample from a different animal. Panel B: Hepatic flotillin-1 mRNA levels normalized to β-actin (Actb) mRNA levels, as assessed by quantitative reverse transcription polymerase chain reactions (qRT-PCR). Shown are means ± SEMs, n=6-8 per group, **p< 0.01 (two-tailed Student’s t-test). Panels C,D: The same liver samples used in Panels A,B were analyzed for their contents of the syndecan-1 HSPG by immunoblot (Panel C) and the syndecan-1 core protein mRNA by qRT-PCR (Panel D, p﹥0.5 by the two-tailed Student’s t-test). Panel E: Syndecan-1 was immunoprecipitated from mouse liver extracts (IP: SDC1, with nonimmune IgG as the negative control), and the IP pellets were subjected to electrophoretic separation. The upper two immunoblots were performed to detect flotillin-1 (IB: Flotillin-1) in the immunoprecipitate, and then the same membranes were stripped and reprobed to detect syndecan-1 (IB: SDC1). The lower three immunoblots show the contents of syndecan-1, flotillin-1, and GAPDH in liver tissue homogenates from the same experiment, i.e., the starting material for each of the co-immunoprecipitations, arranged in the same order as in the upper immunoblots. Panel F: Plot of plasma triglyceride concentrations versus hepatic Flot1 mRNA levels for all control KK mice and all T2DM KKAy mice. All data in this figure are representatives of three independent experiments.