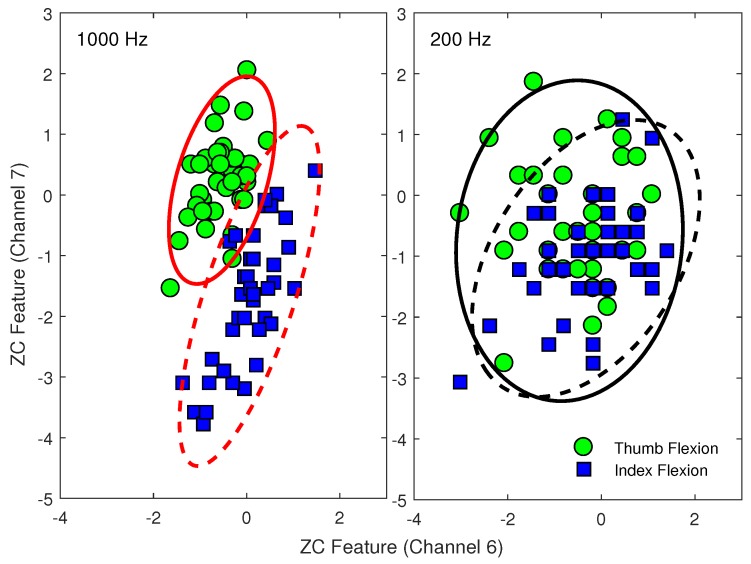
Figure 2.
Differences in EMG patterns between using: (left) a 1000 Hz sampling rate; and (right) a 200 Hz sampling rate. ZC features are extracted from two different EMG channels (6 and 7) during thumb flexion (green circle markers and solid lines) and index flexion (blue square markers and dashed lines). Samples are from Subject 1 of Database 3.

