
Figure 3.
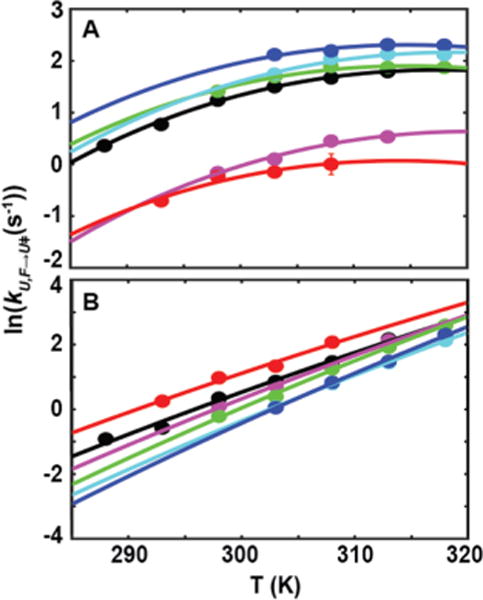
Temperature dependence of folding (A) and unfolding (B) of SH3 in buffer and cosolutes. Buffer, black; 100 g/L urea, red; 50 g/L TMAO, blue; 200 g/L sucrose, cyan; 200 g/L Ficoll, green; 100 g/L lysozyme, magenta. Folding rates in panel A are fit with kcal/mol K, while unfolding rates in panel B are fit with . The uncertainties are smaller than the points, and are listed in Table S4.