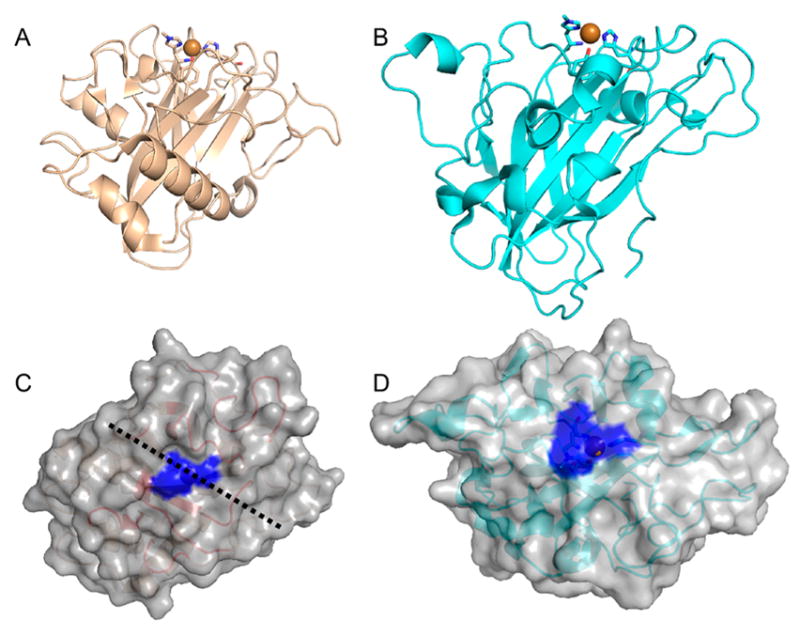
Figure 14.

Side-by-side comparison of AA11, represented by A. oryzae LPMO11 (AoAA11; PDB ID 4MAI) and AA9, represented by T. aurentiacus LPMO9A (PDB ID 3ZUD).92,107 (A) Fold of AoLPMO11 as a cartoon representation with the histidine brace at the top. (B) Same view of TaLPMO9A. (C) AoLPMO11 presumed chitin-interacting surface (active-site histidines colored blue). (D) For comparison, the cellulose-interacting surface of TaLPMO9A (active-site histidines colored blue).
