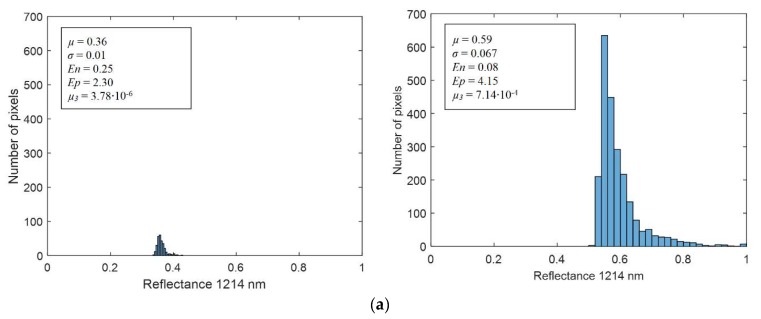
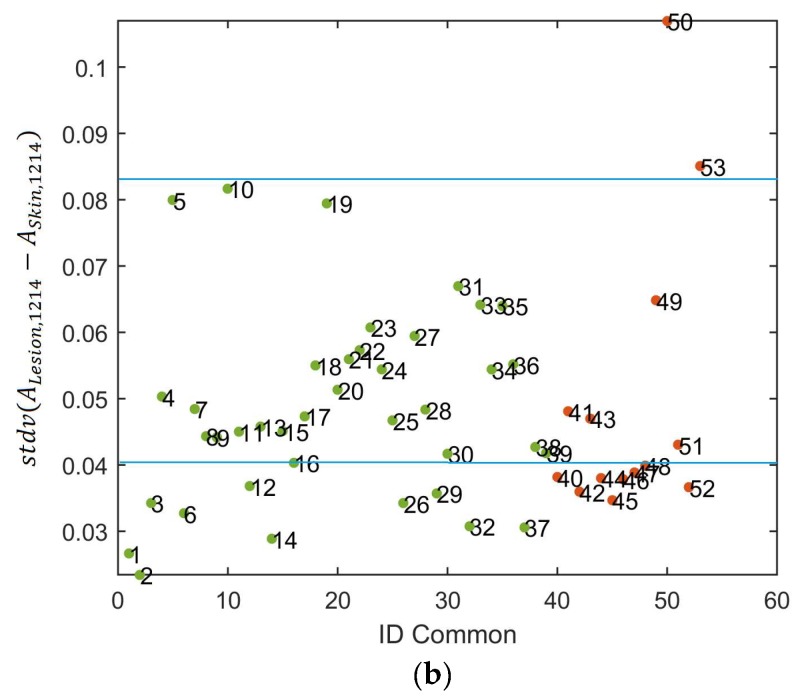
Figure 7.
(a) Reflectance histogram at 1214 nm including the mean (µ), standard deviation (σ), energy (En), entropy (Ep), and skewness or third central moment (µ3) values of a nevus (left) and a melanoma lesion (right). (b) Scatter plot of the spectral absorbance minus the average of the healthy skin in terms of standard deviation at 1214 nm in which manual thresholds have been identified.


