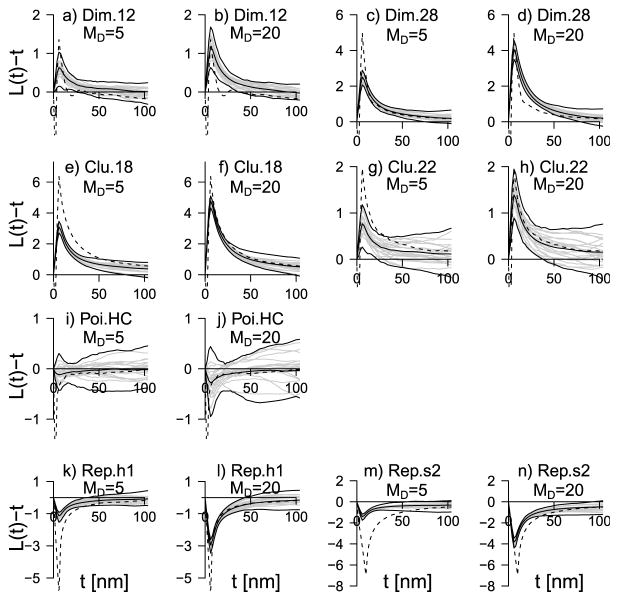
Fig. 4.
Distribution of the centered L̄|Y-function for the various point pattern types, summarized by 98% envelopes based on L̄|Ysynth,i, i = 1, …, 100, together with the mean value ÊL|Y (middle solid line). The value of MD is 5 or 20. In each plot twenty of the L̄|Ysynth,i’s are shown with solid gray curves, the dashed line is the centered L̂E-function.

