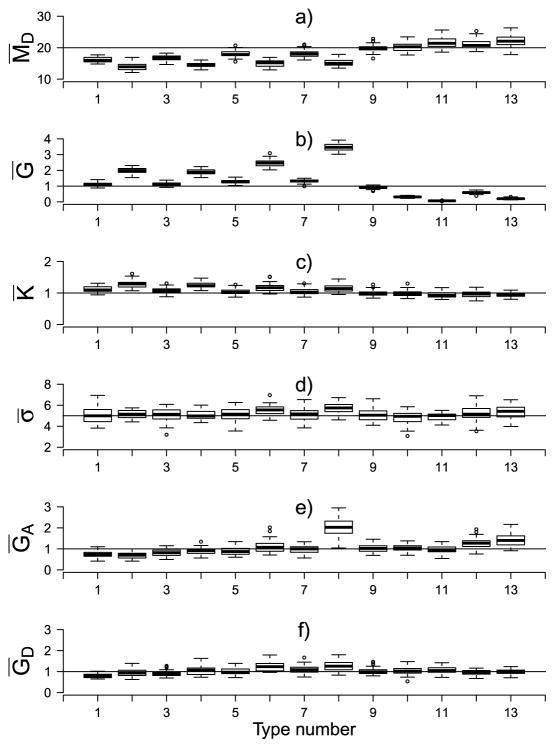
Fig. 6.
Boxplots of the posterior mean of all the six microscope parameters for the forty replicated runs for each of the point pattern types (referred to by their type number, see Table 1) for . The horizontal lines are drawn at the corresponding synthetic values.

