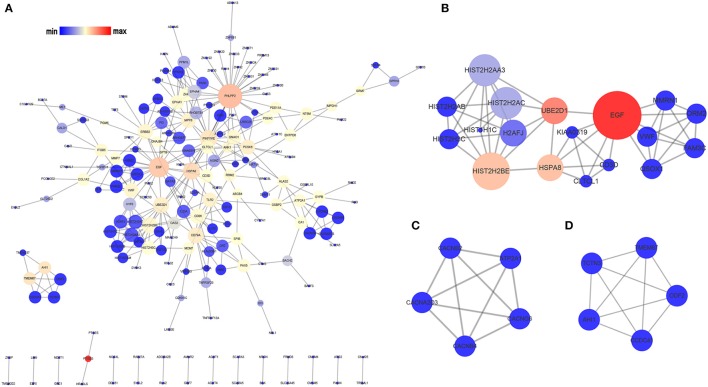
Figure 3.
Analysis of the PPI network of the OMRGs. The nodes represent the OMRGs in the PPI network, and the lines show the interaction between the OMRGs. (A) PPI network of the OMRGs. (B) module 1. (C) module 2. (D) module 3. The node size correspond to degree of the node, while the node color denotes betweenness centrality.

