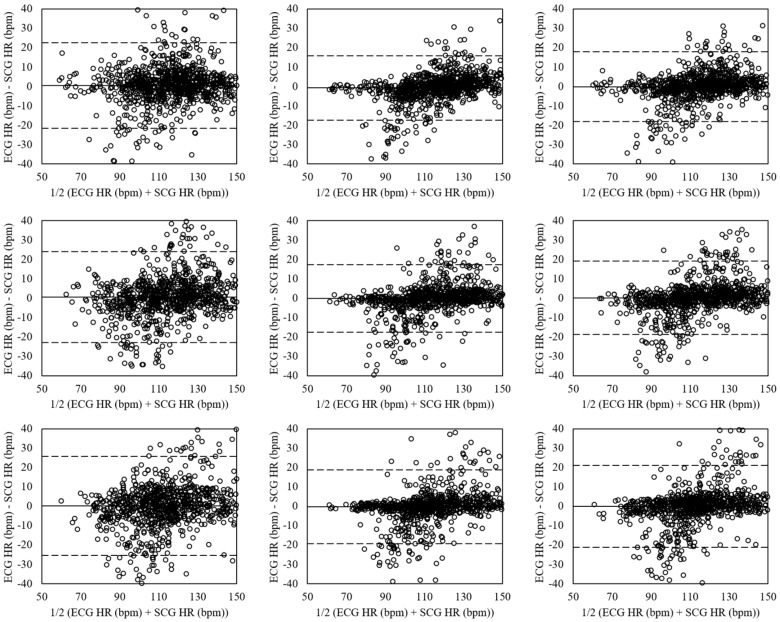
Figure 10.
Bland-Altman plots of heart rates estimated from SCG and ECG by CNNs for running at movement speeds of 6.4 (Left), 8.5 (Mid), and 10.3 (Right) km/h based on the VGG-16 without data augmentation (Top), VGG-19 with data augmentation (Mid), and ensemble network (Down). The lines are the mean errors and 95% LOA.

