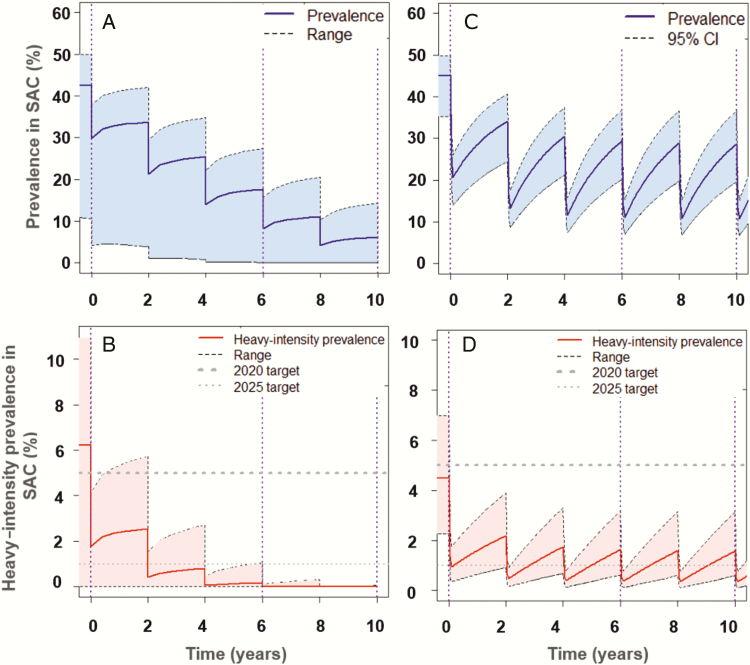
Figure 2.
Imperial College London (A and B) and Case Western Reserve University (CWRU) (C and D) model scenarios showing prevalence of infection (eggs per gram [epg] >0) (A and C), and prevalence of heavy-intensity infections (epg ≥400) (B and D), in school-aged children (SAC) for settings of moderate baseline prevalence. Preventive chemotherapy once every 2 years reaches the morbidity goal by year 6 and may reach the elimination as a public health problem goal by year 10 (reached in 20% of the CWRU simulations). A and B, Shaded areas represent the range of basic reproductive number (R0) values (R0 = 1.22–1.241). C and D, Shaded areas represent the 95% confidence interval (CI) of uncertainty with the range of index of transmission potential (ITP) values (ITP = 1–5.6). The corresponding projections for the incidence of infection in the population are shown in Supplementary Figure 12B.

