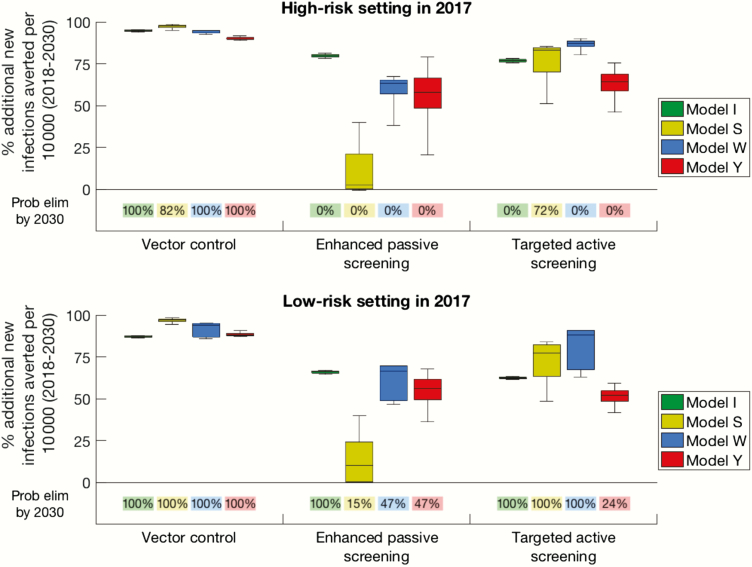
Figure 2.
Results of model simulations in high-risk (A) and low-risk (B) settings for 3 strategies including either vector control (60% reduction in tsetse population), enhanced passive surveillance (double the detection rate), and targeted active screening (double the coverage, including screening high-risk groups). Percentages below boxes denote the probability of a strategy leading to elimination (<1 transmission per 1000000 population) by 2030 for each model. This figure, which displays percentages rather than absolute numbers of infections averted, takes into account the variability between models in the baseline number of new infections expected.

