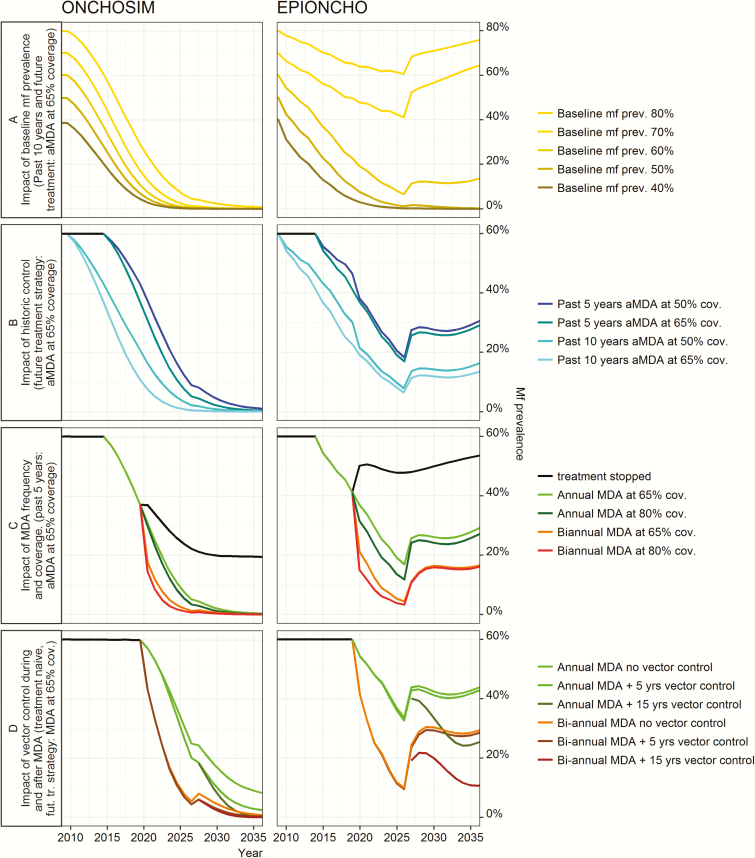
Figure 1.
Illustrative predicted trends in onchocerciasis microfilarial prevalence in different settings of endemicity with different past and future interventions. For full set of graphs, see Supplementary Data 2 and 3. Microfilarial prevalence projected by ONHCOSIM represents the mean per 1000 model runs. The projections are deterministic for EPIONCHO. Labeled future intervention strategies were simulated from 2019 to 2025 (vector control 15 years has vector control but not mass drug administration applied until 2035). A, Precontrol (baseline) microfilarial prevalence. B–D, 60% precontrol microfilarial prevalence. D, No history of control. Abbreviations: aMDA, annual mass drug administration; cov., coverage; fut. tr., future treatment; MDA, mass drug administration; mf, microfilariae; prev. = prevalence.

