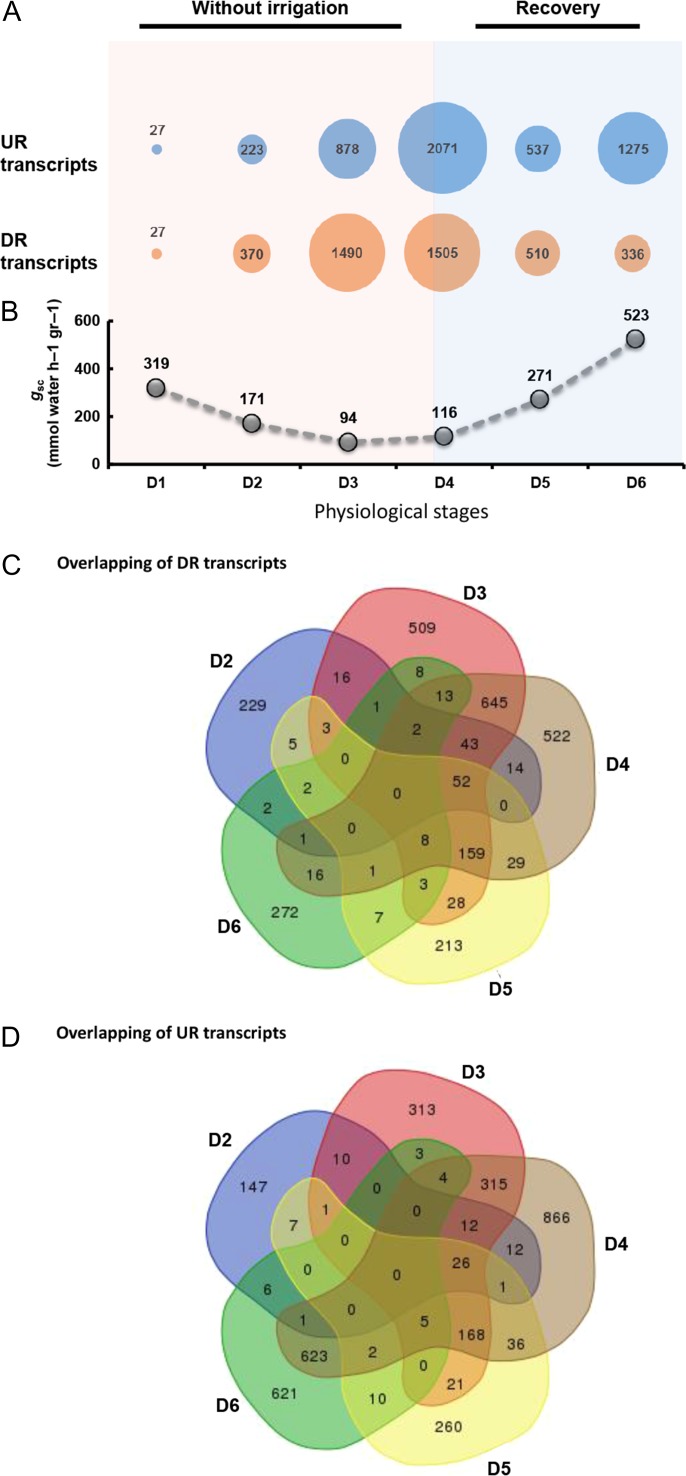
Figure 3.
Differentially expressed (DE) transcripts in response to drought and recovery. (A) The total number of transcripts that were up-regulated (blue) and down-regulated (orange) in response to drought over the course of the experiment. Circle size represents the number of DE transcripts, as compared with the control at each time point (D1–D6). UR, up-regulated; DR, down-regulated. (B) Whole-canopy stomatal conductance (gsc, gray circles) at six physiological stages, D1–D6. D1, pre-stomatal response; D2, partial stomatal closure; D3, minimum transpiration; D4, post-irrigation; D5, partial recovery; D6, full recovery. Venn diagram analysis of down-regulated (C) and up-regulated (D) transcripts at D2–D6 sampling time points.

