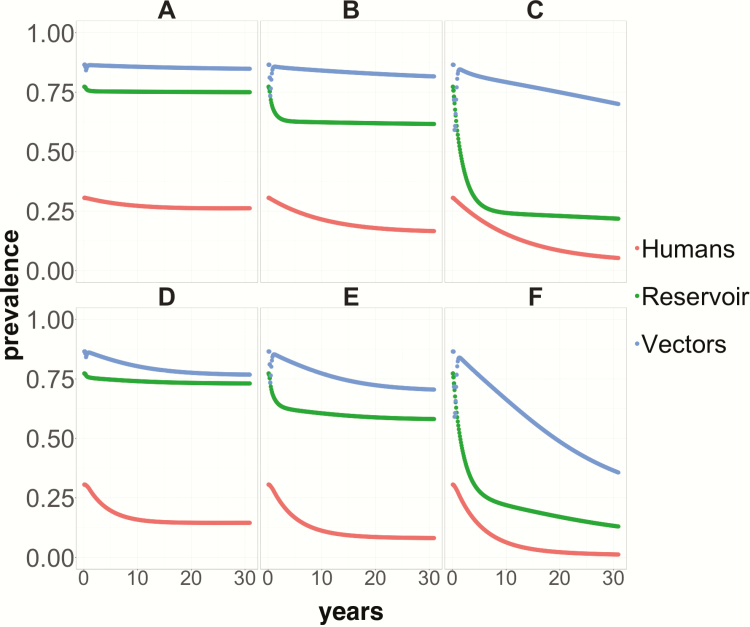
Figure 2.
Infection prevalence in humans (red lines), nonhuman mammal hosts (green lines), and domiciliated Trypanosoma cruzi vectors (blue lines) over 30 years following the implementation of sustained and continuous control strategies beginning at year 1. A, B, and C present, respectively, prevalence trends following vector control on its own that leads to 10%, 50%, and 90% reductions in vector density. D–F depict prevalence trends following implementation of vector control (same reductions in vector density as above) in combination with an annual 10% proportion of parasitological cure in the population through treatment of the T. cruzi–infected human population.

