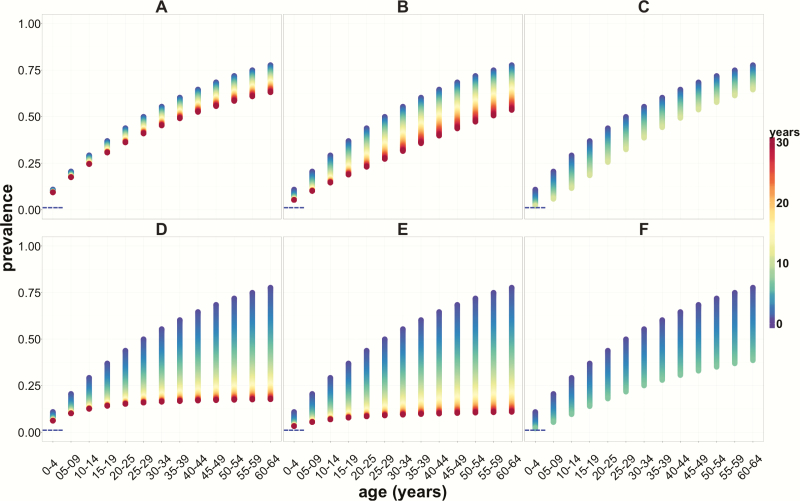
Figure 3.
Age-specific prevalence profiles of Trypanosoma cruzi infection in the human population in a highly endemic setting, following over 30 years the implementation of sustained control strategies. A, B, and C present, respectively, age prevalence profiles corresponding to vector control and status quo treatment (1%), with annual reductions in vector density of 10%, 50%, and 90%. D–F depict human T. cruzi infection prevalence profiles following the same reductions in vector density as above in combination with etiological treatment that effects a 10% population parasite cure among the infected population annually. Horizontal blue dashed lines indicate the 2% seroprevalence threshold in children under 5. The color scale represents time, with blue representing the beginning of the intervention and red representing 30 years of sustained intervention.

