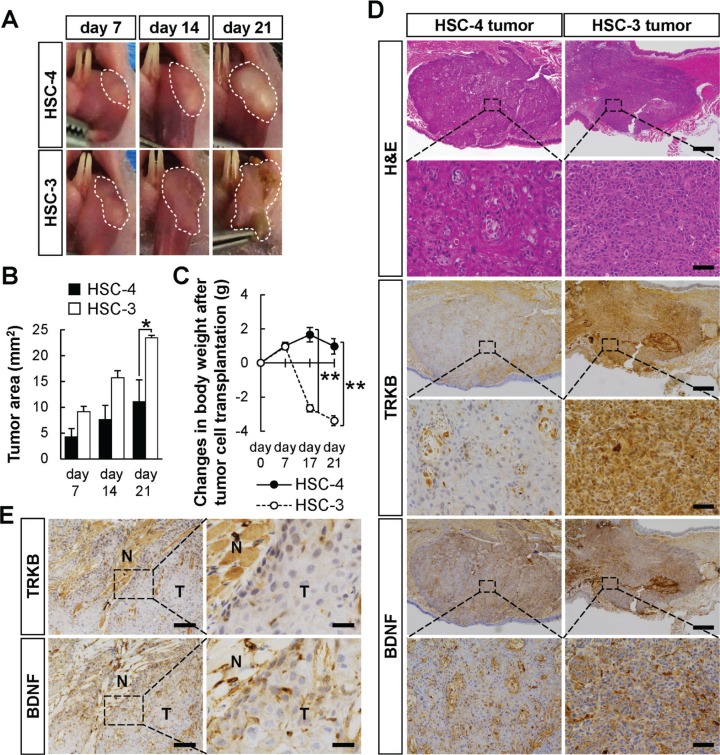
Figure 5. Higher tumor growth of HSC-3 cells orthotopically transplanted in nude mice.
The difference in tumor growth between HSC-4 and HSC-3 cells was examined by orthotopic transplantation into BALB/cSlc-nu/nu mice. (A and B) The tumor growth area in the tongues was photographed every week (A). Histograms show the means ± SEM (HSC-4, filled bar; HSC-3, open bar; n = 3 in each group) of the tumor growth area (mm2) (B). *P < 0.05. (C) Changes in body weight after the tumor cell transplantation. The body weights were measured at the indicated day points (HSC-4, solid line with filled circle, n = 4; HSC-3, dashed line with open circle, n = 6). **P < 0.01. (D) Representative H&E staining and immunohistochemical detection of TRKB and BDNF in the tumor tissues. Representative images of HSC-4 and HSC-3 tumors are shown. Bars represent 500 μm (low magnification) and 100 μm (high magnification). (E) Representative images of immunohistochemical detection of TRKB and BDNF in the invasive front of HSC-4-derived tumors. Tumoral (T) and non-tumoral (N) areas are indicated. Bars represent 100 μm (left panels) and 25 μm (right panels).

