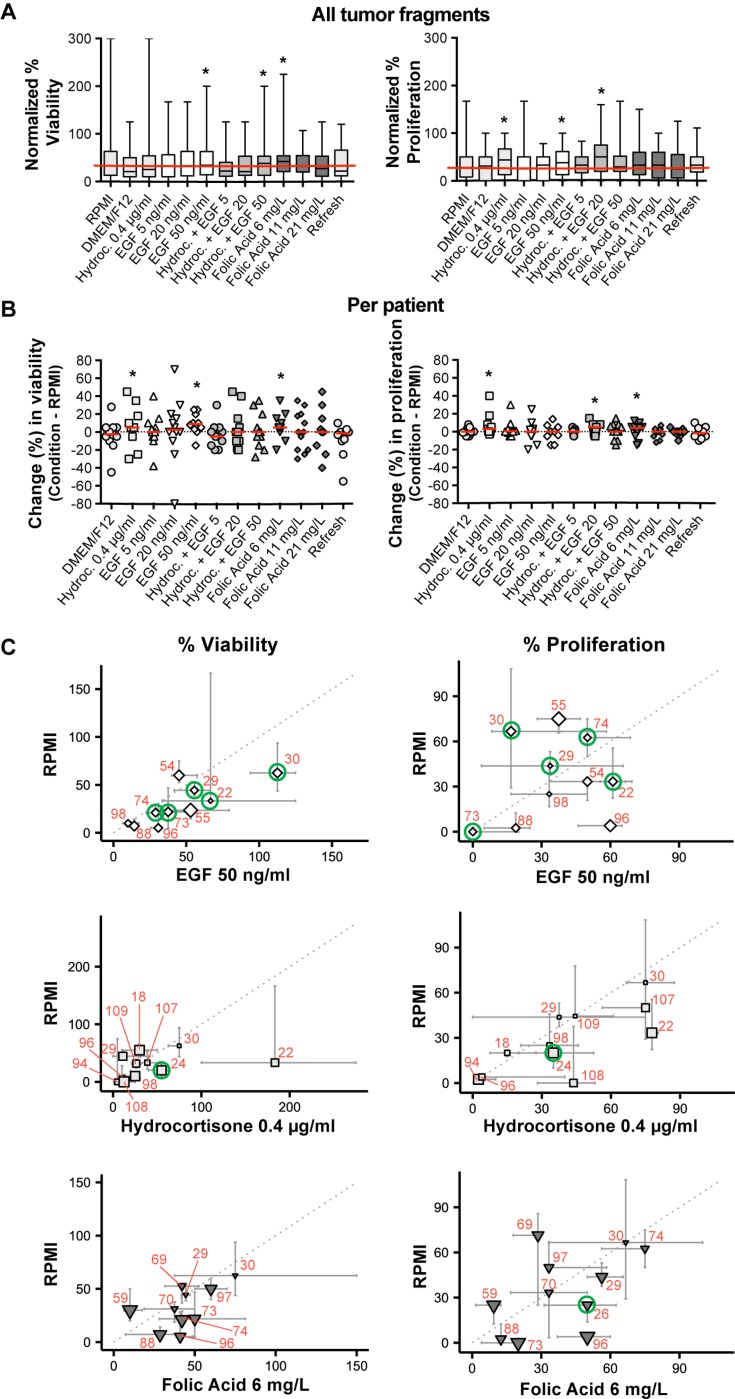
Figure 2. The effect of the culture optimization conditions on tumor viability and proliferation in comparison to standard RPMI, at day 7.
(A) Boxplot of normalized viability and proliferation (median and range) of all tumor fragments cultured with the various optimization conditions. The horizontal red line delineates the median value for the standard RPMI. (*Best conditions.) (B) Scatter plot of raw median viability and proliferation percentages per optimization condition when compared to standard RPMI, depicted per individual patient. A single data point represents the difference between the median individual percentage of an optimization condition and the standard RPMI. The red bar indicates the median of all these single data points within that specific condition. (*Best conditions.) (C) Scatter plot of normalized data per patient for the three best selected optimization conditions (EGF 50 ng/ml ◊, Hydrocortisone 0.4 μg/ml □ and Folic Acid 6 mg/L ▼) versus standard RPMI. One symbol resembles the median of all fragments per individual patient; error bars around the symbols range from the first to the third quartiles. The size of the symbol is inversely proportional to the p-value of a two-sided Mann–Whitney U test comparing the RPMI and the tested optimization condition within one patient. The green circles indicate the selected samples for EGFR and immune cell IHC. For comparison between figures and tables, red numbers indicate individual patients. (Mind the axes that vary between the graphs.)

