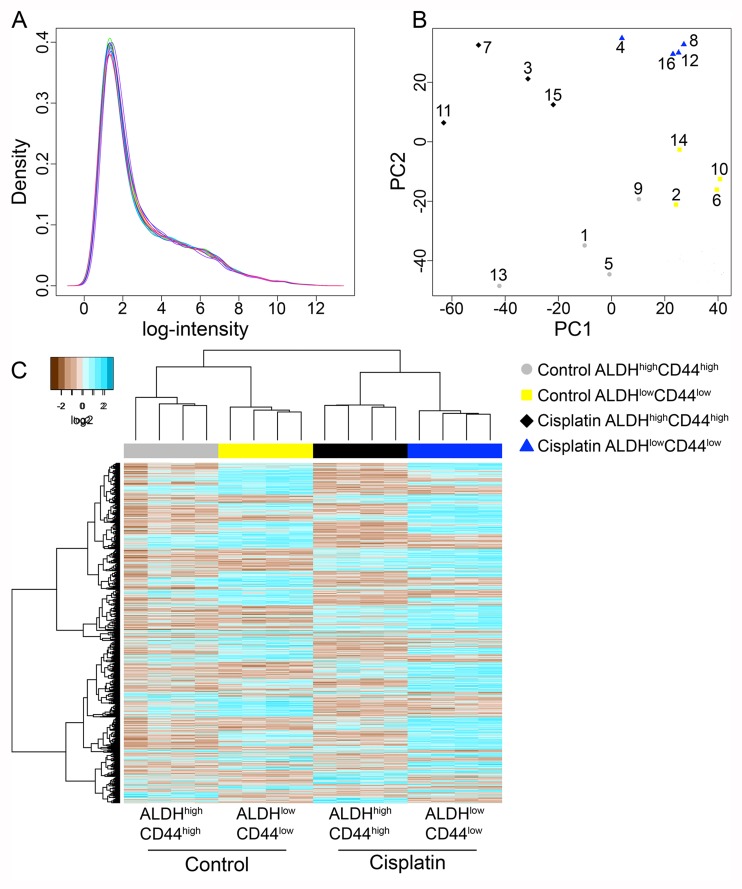
Figure 3. Microarray analysis of ALDHhighCD44high and ALDHlowCD44low cells from control and cisplatin-treated UM-SCC-22B.
(A) Histogram plot of log2 intensity values for 16 microarrays following batch adjustment. (B) Principal component analysis of batch adjusted 16 microarrays showing the 1st and 2nd components with the most variance. Grey circles–Control ALDHhighCD44high; yellow squares–Control ALDHlowCD44low; black diamonds–Cisplatin ALDHhighCD44high; blue triangles–Cisplatin ALDHlowCD44low. Exp #1: 1–4; Exp #2: 5–8; Exp #3: 9–12; Pilot Exp: 13–16. (C) Unsupervised hierarchical clustering with complete linkage and Euclidean distance was performed on only statistically significant probes (adjusted p-value < 0.05).

