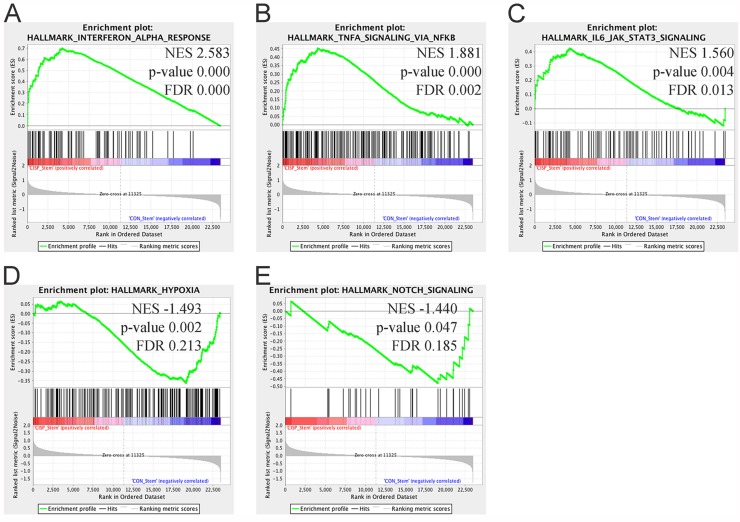
Figure 4. Gene Set Enrichment Analysis of cisplatin ALDHhighCD44high vs. control ALDHhighCD44high cells.
Gene set enrichment analysis using “Hallmark” gene sets based on comparison between cisplatin ALDHhighCD44high and control ALDHhighCD44high cells. (A–C) Gene sets enriched in cisplatin ALDHhighCD44high cells with FDR < 0.25 and p-value < 0.05. (A) Interferon Alpha Response, (B) TNFα Signaling Via NF-κB, (C) IL6-JAK-STAT3 Signaling. (D–E) Gene sets enriched in control ALDHhighCD44high cells with FDR < 0.25 and p-value < 0.05. (D) Hypoxia, (E) Notch Signaling. NES–Normalized Enrichment Score.

