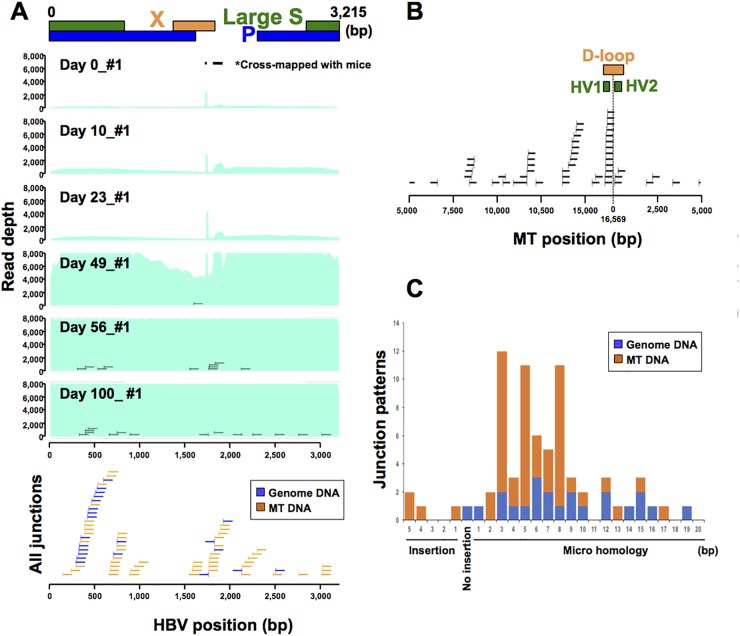
Figure 1. HBV infection model using human-hepatocyte chimera mice.
(A) Representative image of depth of coverage of HBV genome and integration sites in chimera mouse model 0, 10, 23, 49, 56 and 100 days after HBV infection (upper). Light green coloration indicates the HBV coverage depth. HBV junctions are indicated by vertical bars, with remaining sections of the integrated sequence indicated by horizontal lines. All junction sites and sections of integrated sequences were shown in blue (genomic DNA) and yellow (mtDNA) lines (lower). Two peaks (*) in HBV depth were derived from cross-mapped sequences from DNA obtained from mouse cells. (B) Distribution of HBV integration sites in mtDNA. (C) HBV junction site analysis. Patterns of HBV junction sites with insertions or microhomology in their reference sequence were shown by their length (bp). Blue and yellow indicates HBV junctions with genomic and mtDNA.

