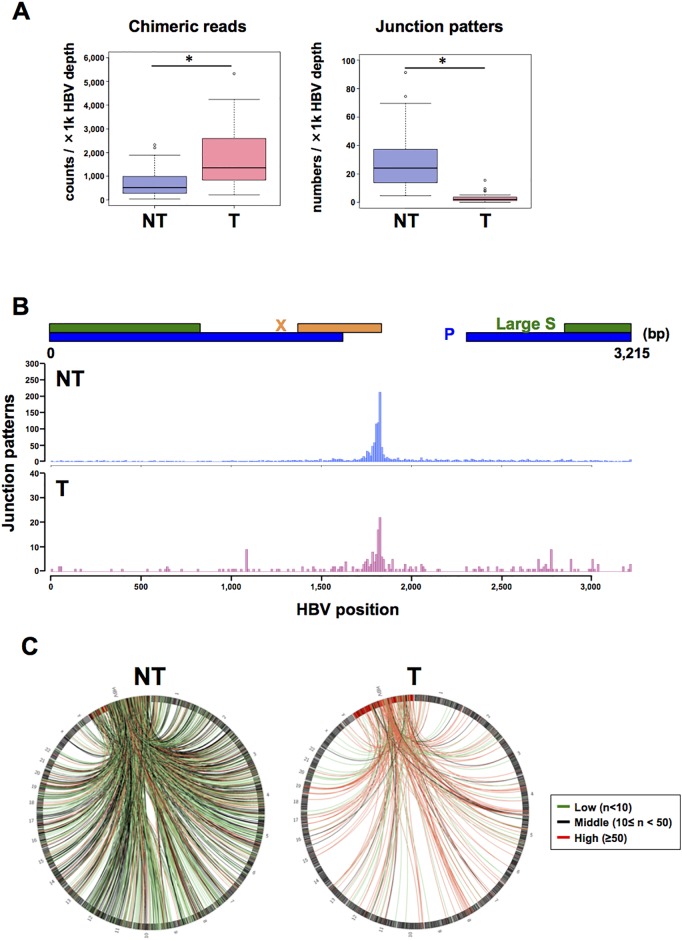
Figure 2. Visualization of HBV integration sites in the HBV and human genomes.
(A) The number of chimeric reads (left) and junction patterns (right) detected via HBV-CapSeq in non-tumorous (NT, blue) and tumor (T, pink) samples. *p < 0.05 (paired Student's t test). (B) The number of integration breakpoints at different sites in the HBV genome. (C) Circos plot showing the distribution of integration sites in the HBV genome (red bars) and in human chromosomes (black bars). Red, green, and black lines indicate junctions with >50, <10, and other read counts, respectively.

