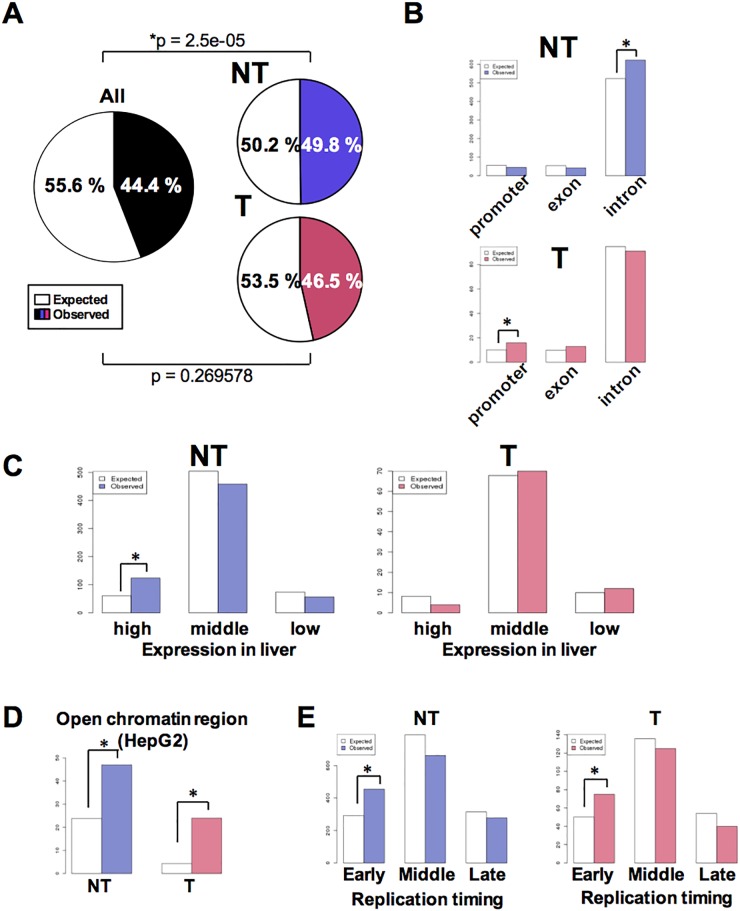
Figure 3. Characteristics associated with HBV integration of HBV into NT and T samples.
(A) Pie charts showing the proportion of gene body and intergenic regions in the human genome. Gene body regions were defined as exons, introns, or gene promoters (i.e., spanning 5 kb upstream to the gene transcription start site). Colored and white sections indicate the comparative proportions of gene body and intergenic junctions. (B) The number of HBV integration sites in gene promoters, exons, or introns among all NT and T samples. White and colored bars indicate the expected and observed number of integration sites, respectively. *p < 0.05. (C) The number of HBV integration sites in genes found to be highly expressed in liver tissues. The expression status of the various genes in liver tissues was calculated as the mean expression level exhibited by 50 non-cancerous liver tissue samples previously described in [36]. After exclusion of genes with a Coefficient of Variation greater than 1.0, the 10% of genes that were most highly expressed and the 10% of genes that exhibited the lowest expression level were determined. *p < 0.05. (D) The expected (white) and observed (colored) number of HBV junctions in open chromatin regions in HepG2 cell. Open chromatin regions were defined using HepG2 DNase-Seq data (https://www.encodeproject.org, GEO: GSM816662). (E) The expected (white) and observed (colored) numbers of HBV junctions in regions classified as ‘early,’ ‘moderate,’ or ‘late’ with regards to replication timing (defined using HepG2 Repli-seq data (GEO:GSM923446)). The ‘early’ and ‘late’ junctions were defined as regions found to exhibit greater than 70 or less than 20 gene expression signals, while those found to exhibit 20–70 gene expression signals were defined as ‘mod’.

