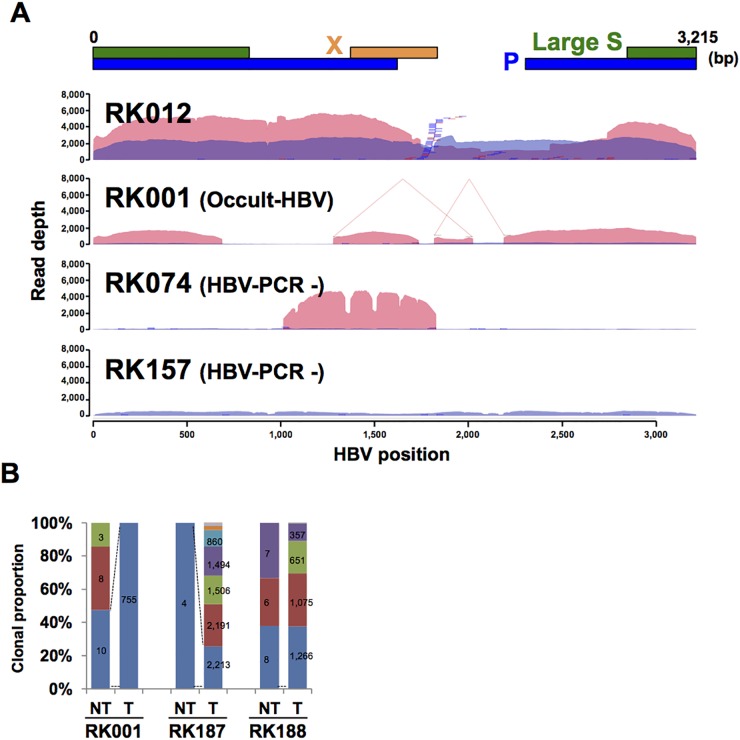
Figure 4. HBV integrations in paired NT and T samples.
(A) Representative image showing the depth of coverage of the HBV genome, and the integration sites identified by HBV-Capture-Seq. Blue and pink coloration indicates the HBV coverage depth in non-tumor (NT) and tumor (T) samples. Blue and red bars indicate junctions in NT and T samples. HBV junctions are indicated by vertical bars, with remaining sections of the integrated sequence (35 bp) are indicated by horizontal lines. Positions of structural variations within HBVs are depicted by connected lines. (B) The clonal proportion of HBV junctions in an occult HBV case. The proportion of each junction detected in the NT sample is shown, and the identically colored block indicates the shared junction between the NT and T sample. Numbers indicate the supporting read counts for each junction.

