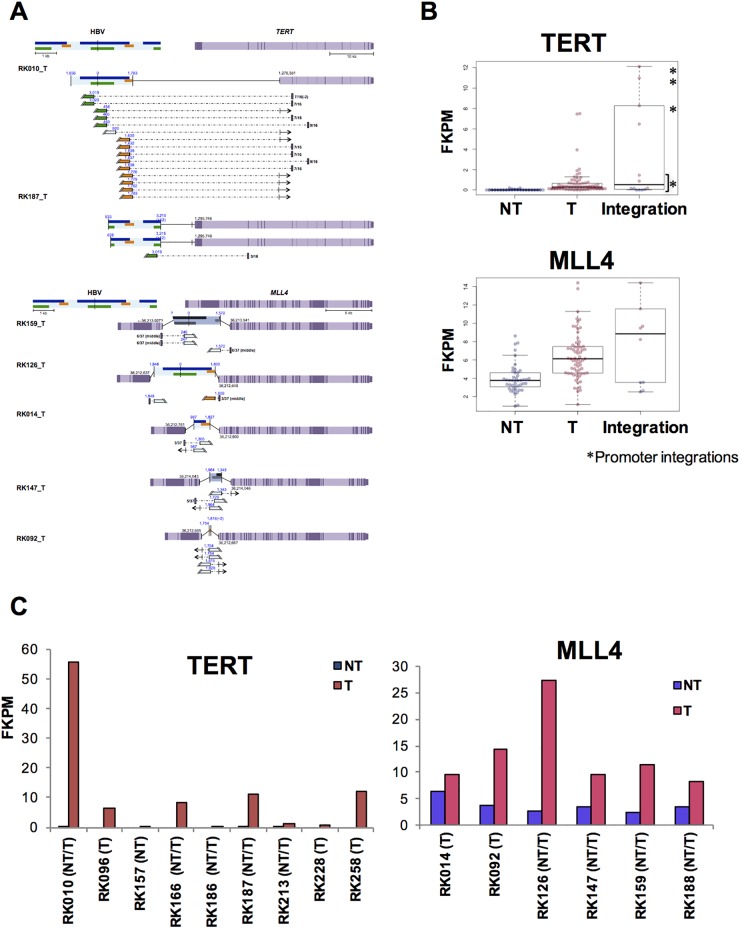
Figure 5. Influence of HBV integrations on TERT and MLL4 expression in T samples.
(A) Expected gene structure of HBV integrations and corresponding HBV fusion transcripts for TERT (upper) and MLL4 (lower). Corresponding HBV and human genomic structures are shown, including HBV genes encoding Large S (green), P (blue), and X (yellow) proteins, as well as gene exons (purple) and introns (light purple). Fusion transcripts that were determined to contain junctions via RNA-Seq are depicted (connected boxes), and the direction of gene expression (arrows) is indicated. (B) The expression status of TERT (upper) and MLL4 (lower), as determined by RNA-Seq. Samples include both HBV integrations and, in the control, non-integrated NT and T samples. Blue and pink plots indicate NT and T samples, respectively.*samples with integrations in promoter regions. (C) Expression status of TERT (left) and MLL4 (right) in integrated samples. Blue and pink bars indicate NT and T samples.

