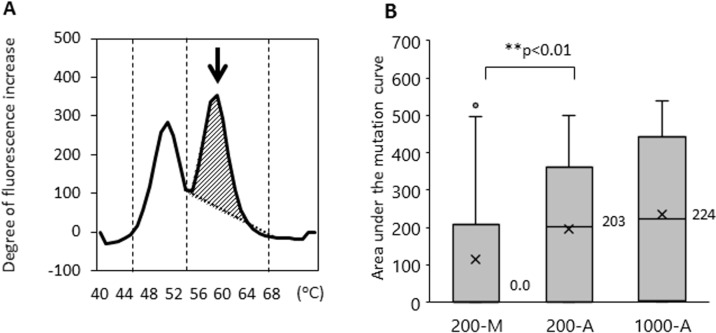
Figure 3. The area under the mutant curves (mutant AUC) was correlated with the mutant allele copy number.
The mutant AUC is illustrated in (A). The arrow indicates the mutation peak. The mutant AUC for L858R was defined as the integral under the curve between 56° C and 68° C using the MBP-QP method, and was calculated by the i-densy AreaAna® software. (B) The mutant AUC with plasma DNA extracted by the automated method (200-A, 1000-A) and that by manual procedure (200-M). The numbers next to the bar charts are the mean values of mutant AUC, and an X represents the average of mutant AUC. Freidman's test was used for analysis.

