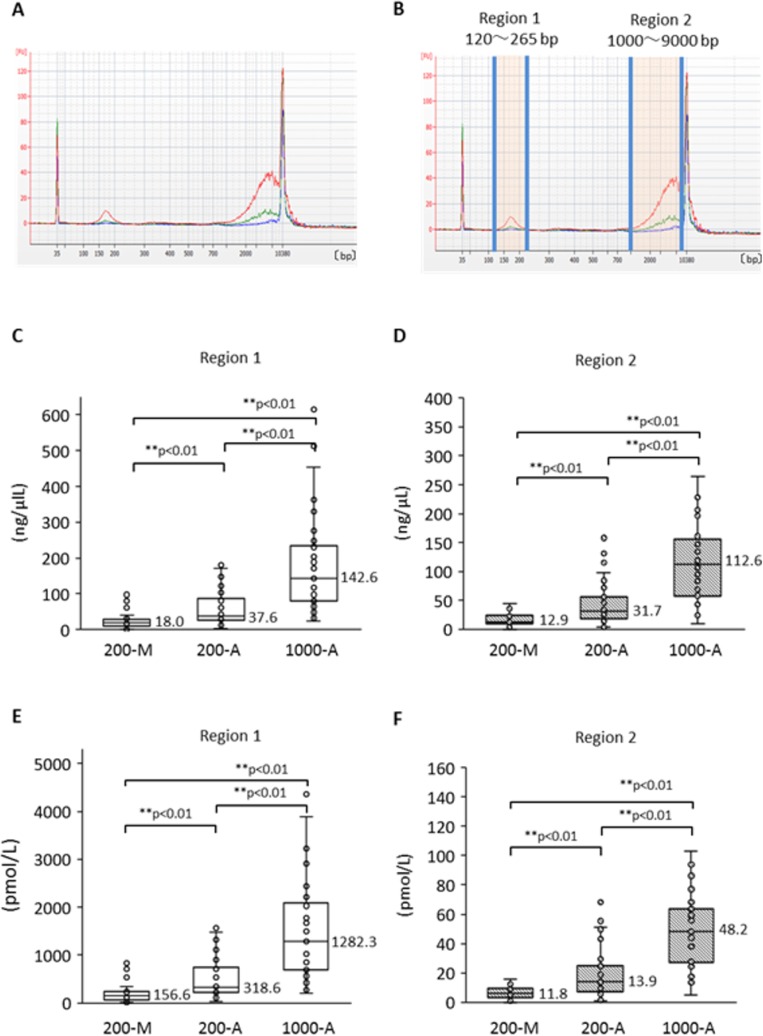
Figure 4. Size distribution of plasma DNA analyzed by Agilent Bioanalyzer and its difference according to extraction method.
(A) Representative size distribution pattern with each plasma DNA extraction method. Blue shows 200-M, green is 200-A, and red is 1000-A. (B) The definitions of “Region 1” and “Region 2”. DNA concentration and molality were measured by an Agilent Bioanalyzer. Comparison among DNA isolation procedures (200-M, 200-A, and 1000-A) was performed for concentration (C, D) and molarity (E, F) with Freidman's test and multiple pairwise comparisons.

