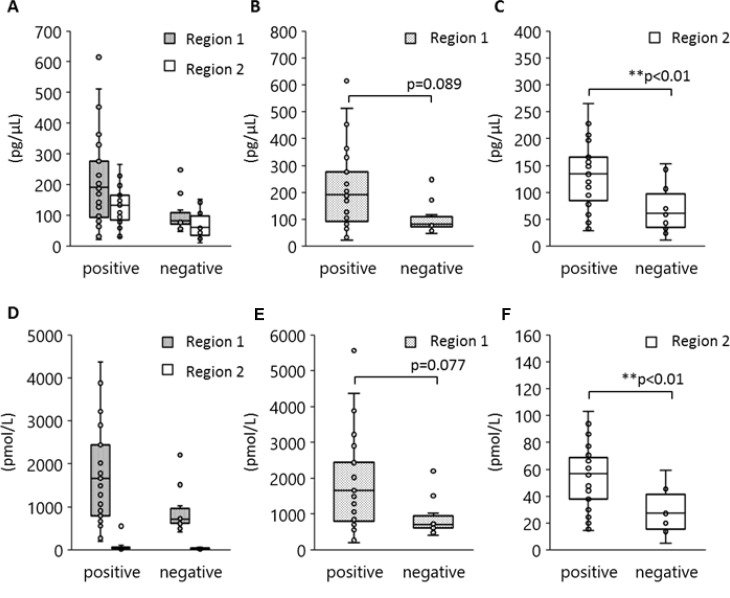
Figure 5. Association between EGFR L858R positivity and DNA amounts in regions 1 and 2.
Peripheral blood was collected from 40 patients with NSCLC who carried EGFR L858R as verified by tissue biopsy and plasma DNA extracted by method 1000-A. DNA concentration and molarity were analyzed according to plasma L858R positivity as determined by the MPB-QP method. Concentration and molality of regions 1 and 2 DNA fragments were measured by an Agilent Bioanalyzer. The concentration (A–C) and molarity (D–F) of regions 1 and 2 are shown. Statistical analyses were performed with the Mann–Whitney U test. Two asterisks denote p < 0.01.

