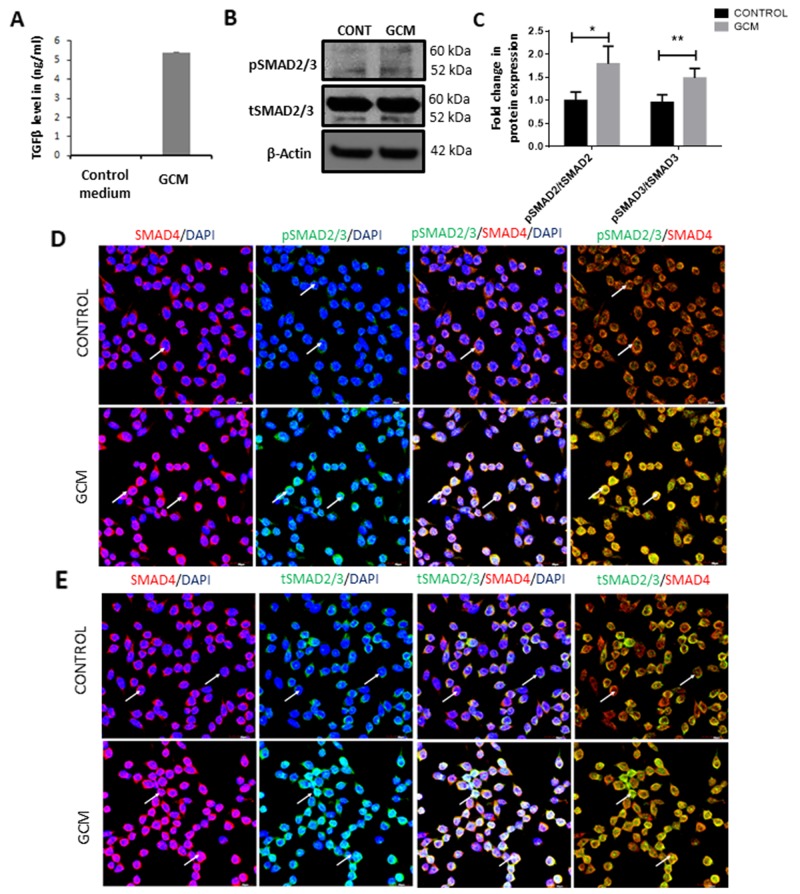
Figure 1. GCM induces TGFβ signaling pathway in microglia.
ELISA assay quantification revealed that GCM contains ~5ng/ml of TGFβ (A). Western Blot (B) shows an increase in phosphorylated form of pSMAD2/3 in microglia treated with GCM when compared with control. Histogram depicts densitometric quantification of pSMAD2/3 normalized against total SMAD2/3 expression (C) Data represent mean±SD, (n=4), Students t-test, *p<0.05, **p<0.01. Confocal images show pSMAD2/3 (green, D), total SMAD2/3 expression (green, E) and SMAD4 expression (red, D, E) in BV2 microglia (indicated by arrows). Cell nuclei are labelled with DAPI (blue). GCM increases immunofluorescence intensity of pSMAD2/3 as compared to control cells (D). Immunocolocalization of pSMAD2/3, total SMAD2/3 and SMAD4 reveals that pSMAD2/3 and total SMAD2/3 colocalize with SMAD4 in microglia treated with GCM (D, E). Scale bar=30μm.

