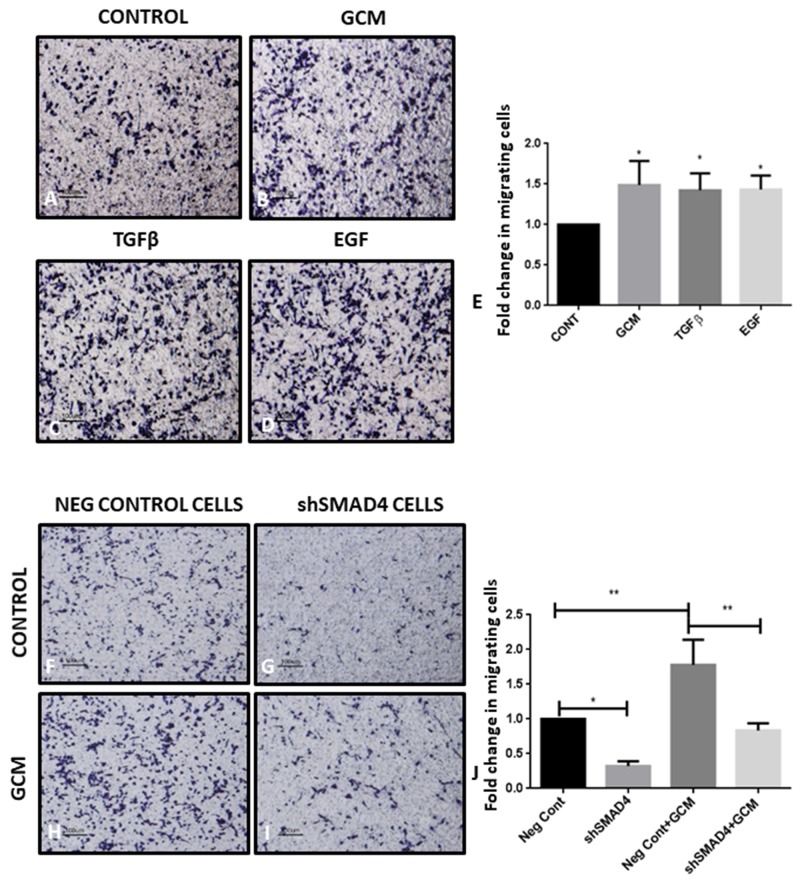
Figure 5. shRNA-mediated knockdown of SMAD4 suppresses microglial migration.
Trans-well membrane image panels show an increase in the number of migrated microglial cells (purple) after exposure to GCM (B), TGFβ (C) and EGF (D) as compared to cells exposed to serum containing medium (A). Histogram depicts fold change in migrating cells exposed to GCM, TGFβ and EGF as compared with control group (E). Data represent mean±SD, *p<0.05, **p<0.01, (n=3). There was a decrease in the number of migrated shSMAD4 microglial cells (purple) in response to GCM and serum containing medium (I, G) as compared to negative control (Neg Cont) microglial cells exposed to GCM and serum containing medium (H, F). Histogram depicts fold change in migrating cells (J). Data represent mean±SD, (n=3), *p<0.05, **p<0.01.

