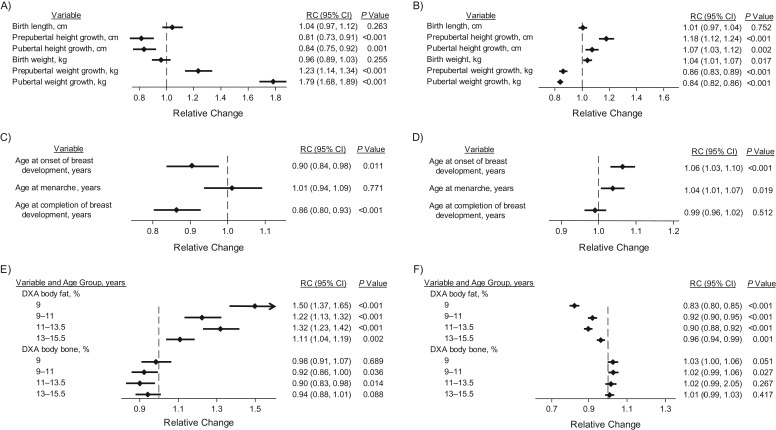
Figure 2.
Associations of magnetic resonance imaging (MRI) breast measures with observed measures of height and weight, pubertal development, and dual-energy x-ray absorptiometry (DXA) percent body fat and bone masses, Avon Longitudinal Study of Parents and Children, 1991–2014. The graphs show the estimated relative change (RC) in breast measures per 1–standard-deviation increment in the exposure variable of interest for MRI breast volume (left column; parts A, C, and E) and percent water (right column; parts B, D, and F). The vertical dashed line represents no change (i.e., RC = 1). RC estimates were adjusted for age and menstrual phase at MRI examination and all of the other variables in the same category (i.e., height/weight growth trajectories, pubertal development, or DXA measures). Prepubertal and pubertal height/weight growth were estimated as defined in the Methods section and in the footnotes of Table 2. Bars, 95% confidence intervals (CIs).

