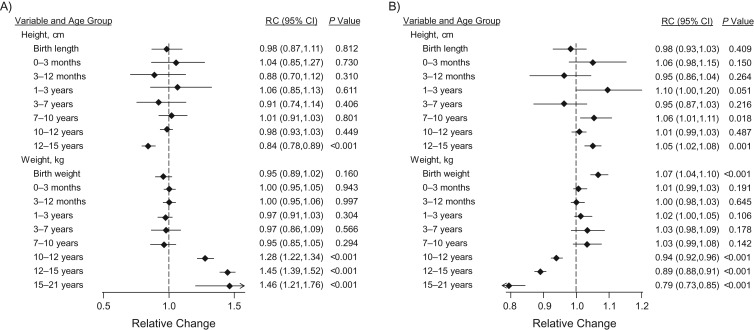
Figure 3.
Mutually adjusted associations of magnetic resonance imaging (MRI) breast measures with height and weight velocity trajectories, Avon Longitudinal Study of Parents and Children, 1991–2014. The graphs show the estimated relative change (RC) in breast measures per 1–standard-deviation increment in the exposure variable of interest for MRI breast volume (A) and percent water (B). The vertical dashed line represents no change (i.e., RC = 1). RC estimates were adjusted for age and menstrual phase at MRI examination and all of the other variables listed in the graph. Measures of height and weight growth from birth to age 10 years were derived using linear spline multilevel modeling of height and weight (16). From age 10 years onward, standardized growth measures were calculated from a piecewise mixed-effect model with knots at ages 10, 12, and 15 years (see Methods section, Web Tables 1 and 2, and Web Figures 1 and 2). Bars, 95% confidence intervals (CIs).

