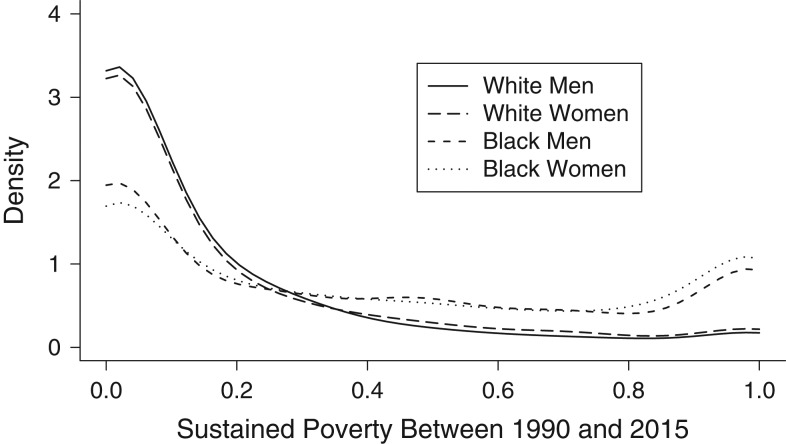
Figure 1.
Distribution of sustained poverty across sex and racial groups, Coronary Artery Risk Development in Young Adults study, United States, 1990–2015. This density function represents the probability of having a specific value of sustained poverty, which is determined by both the height and width of each data point. Thus, height can exceed 1 with a narrow width. Sustained poverty values of “0.0” indicate never in poverty over the 25-year study period (i.e., between 1990 and 2015), and “1.0” indicates always in poverty.

