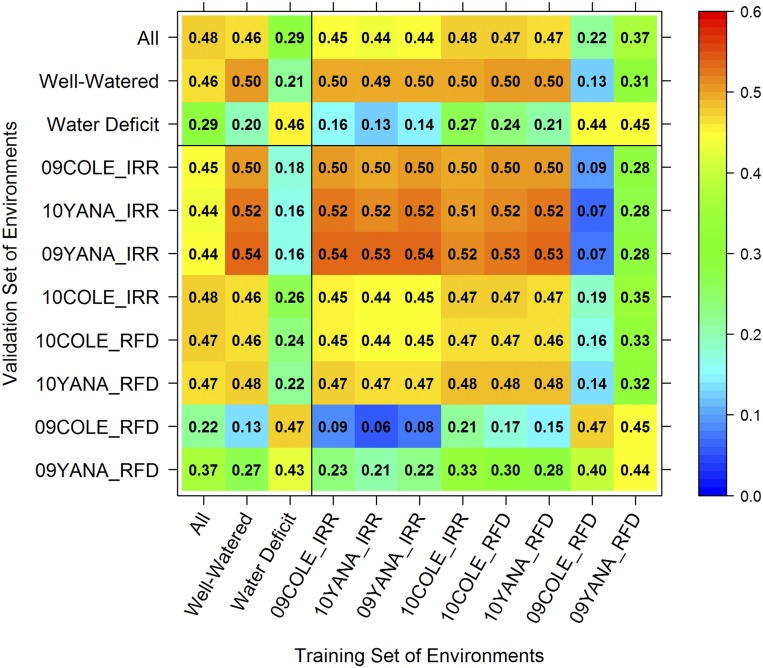
Figure 2.
Predictive ability of GEBVs average across all experiments, averaged across experiments within each environment cluster (well-watered or water-deficit), or predicted for each specific experiment. The training set of environments is given by the X axis, and the validation set of environments is given by the Y axis. Experiment codes are given as year-site-irrigation treatment. Diagonal values represent ability of GEBVs within a given environment to predict GVs in the same environment. Off-diagonal values represent the ability of GEBVs in a given environment to predict GVs in a different environment.

