Figure 2.
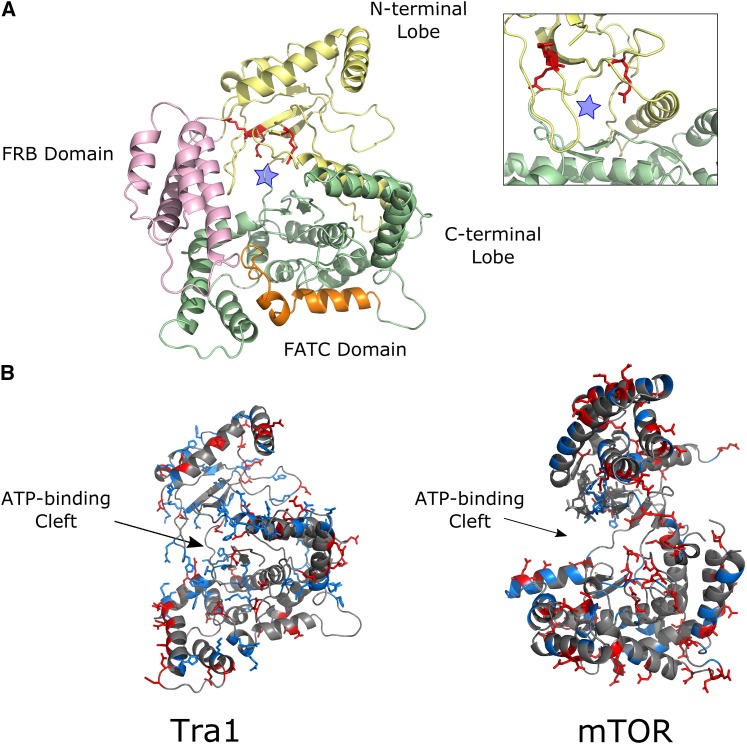
Structural prediction of the Tra1 PI3K domain. (A) Arginines at positions 3389, 3390 and 3456, identified from the alignments, were mapped onto the cryo-EM structure of Tra1 and colored red (Diaz-Santin et al. (2017); PDB: 5OJS; residues 3200-3744 are shown). The “ATP-binding” cleft is marked by a blue star. (B) The distribution of positive and negatively charged residues in the Tra1 PI3K domain (as above) was compared to the distribution in the mTOR crystal structure (Yang et al. (2013); PDB: 4JSV; residue 2000 - 2549). PyMOL (https://pymol.org/2/) was used to color basic residues blue and acidic residues red. The FRB domain of Tra1 (residues 3240 - 3330) has been removed to better visualize the kinase cleft. Both molecules are oriented using the ATP-binding cleft, with the N-terminal lobe of the kinase at the top of the representation.

