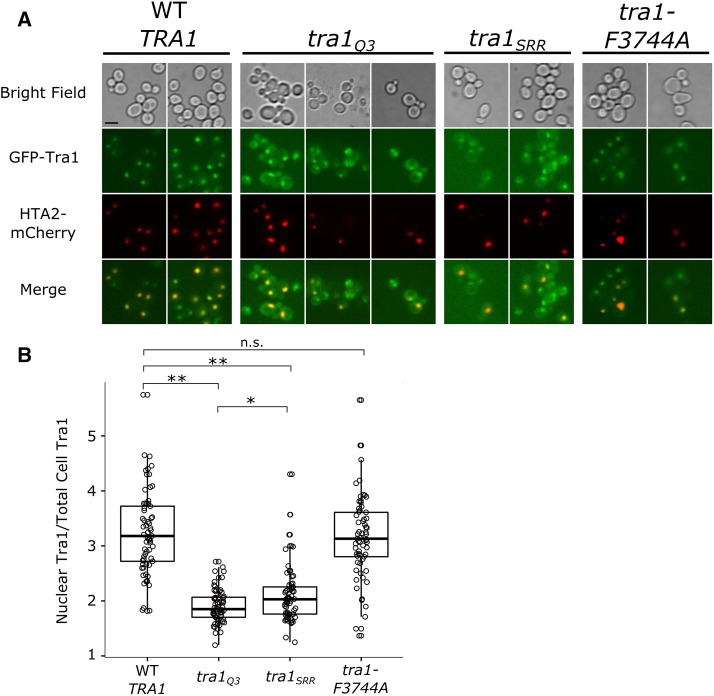
Figure 6.
Tra1 is inefficiently transported to the nucleus. (A) Yeast strains expressing eGFP-TRA1 (CY5998), eGFP-tra1 (CY7341), eGFP-tra1 (CY7607) or eGFP-tra1-F3744A (CY6016) and HTA2-mCherry were grown to stationary phase in media lacking uracil and containing 200 μg/mL G418, diluted 1:20 and grown to mid-logarithmic phase. Cells were washed twice in sterile water before imaging. The scale bar represents 5 μm (B) Box-plot showing the ratio of nuclear to cytoplasmic GFP signal from the strains presented in part (A). The box signifies the upper and lower quartiles and the median is represented by the solid black line within the box. Each point represents signal from one individual cell. Signal was quantified using ImageJ for 65 individual cells from each strain. The nucleus was identified using the mCherry signal and the total cell was identified from bright field images. Cytoplasmic signal was calculated as the difference between the total signal and the nuclear signal. Stars indicate statistically significant differences between means according to Welch′s t-test and testing at a significance level of α = 0.01 after Bonferroni correction (** = P < 0.001, * = P < 0.01, n.s. = P > 0.01).

