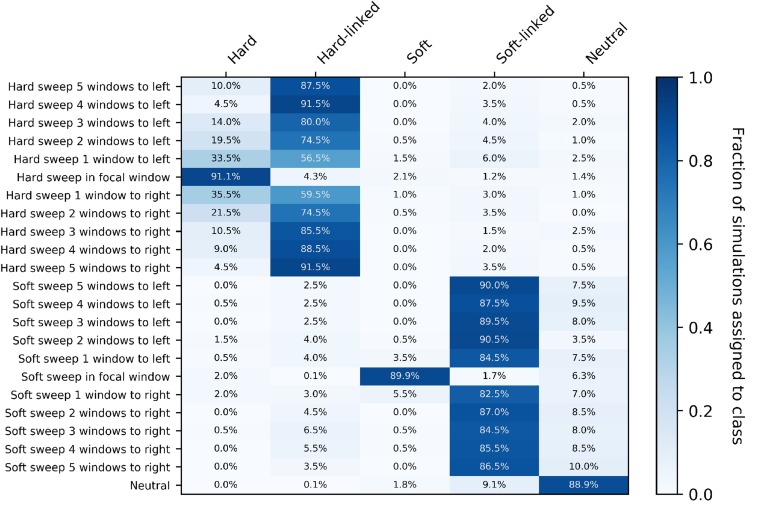
Figure 10.
Confusion matrices of diploS/HIC for an Anopheles gabiae demographic history. On the y-axis the location of the classified subwindow relative to the sweep is shown while the x-axis shows the predicted class for each subwindow from diploS/HIC. These results are from simulations using the parameters reflecting the population history of a BFS sample of Anopheles gambiae, using a sample size of haploid chromosomes. Here we have simulated sweeps with moderate selection coefficients, .

