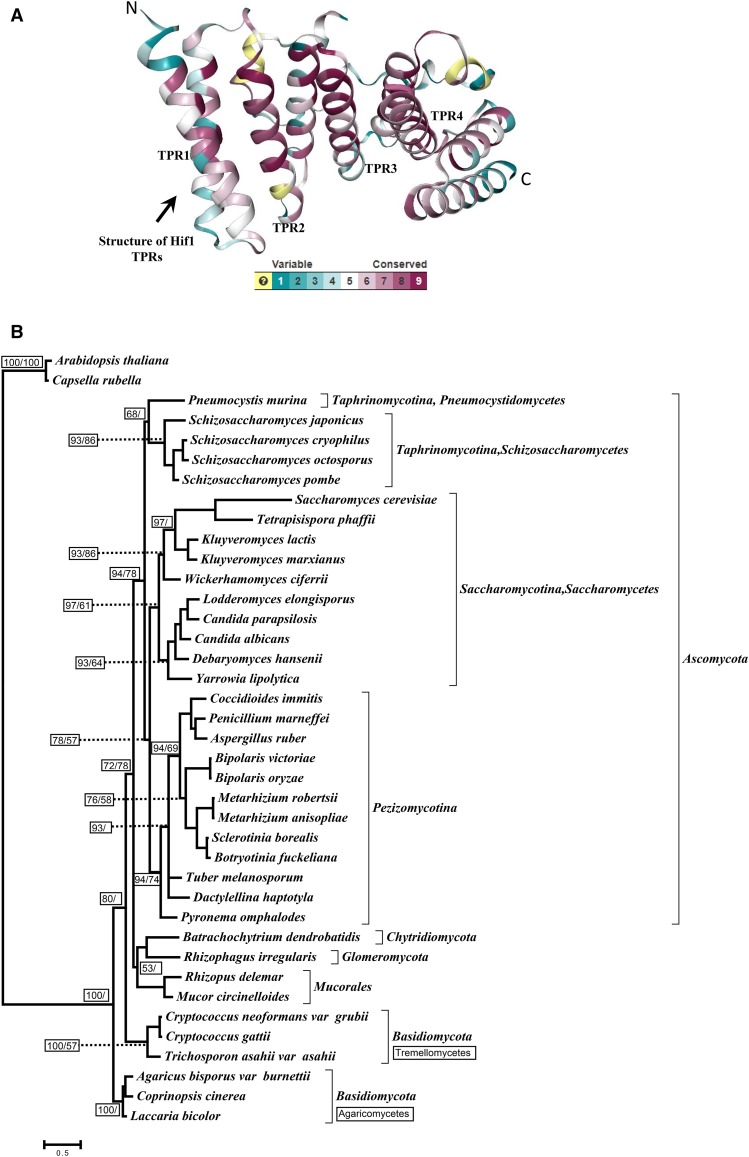
Figure 1.
Structural conservation of Hif1 and Phyogenetic analysis. A: Cartoon representation of Hif1 structure (PDB ID: 4NQ0) indicating the degree of conservation as calculated by the program ConSurf based on sequence alignment of fungal homologs. Conservation key is provided with 9 being the most conserved and 1 being the most variable. Note: The light yellow color represents the regions where conservation was not deteremined. B: The phylogenetic tree was reconstructed using TPR 1–4 amino acid sequences and tree topology and branch lengths are based on Bayesian inferences. The average standard deviation of split frequencies from two runs was 0.006. Confidence values are provided in small boxes. The Posterior probability values are indicated on the left within small boxes whereas bootstrap values (based on 200 replicates) for the ML tree are shown on the right (reported only when ≥ 50%). Different fungal groups are indicated in the right margin. The scale bar shows the number of substitutions per site. The tree was rooted using Capsella rubella and Arabidopsis thaliana as out groups.

