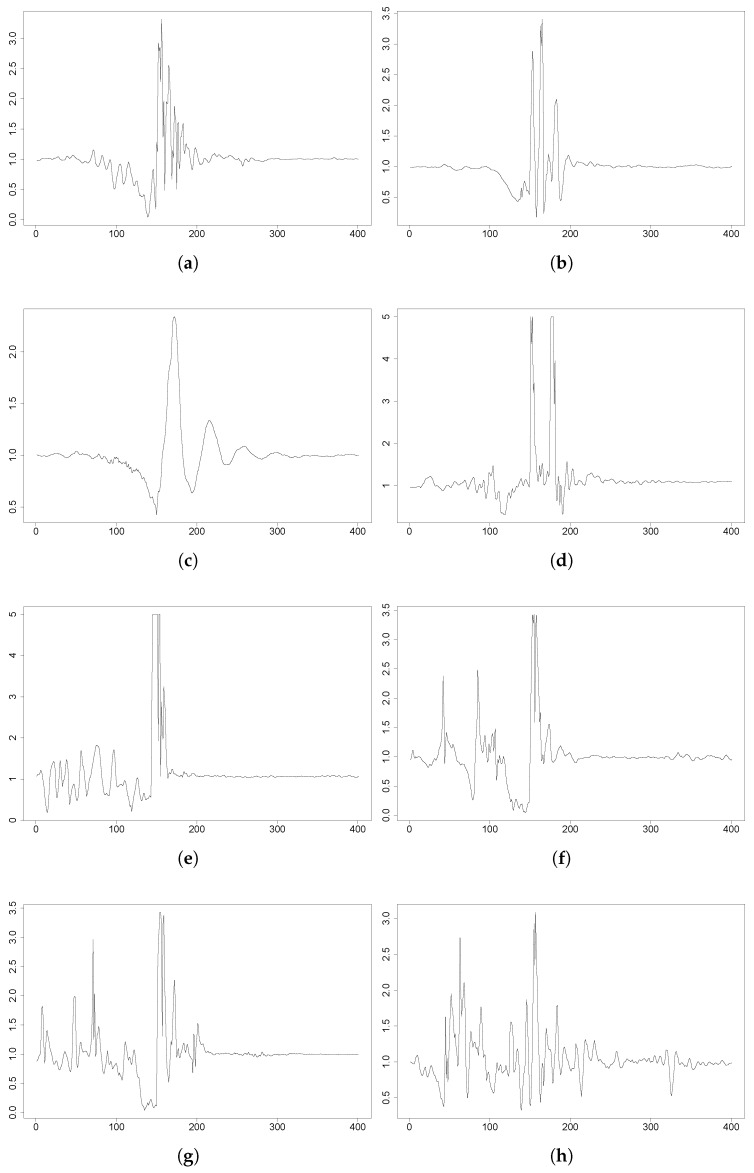
Figure 5.
FARSEEING plots of some falls depicting the magnitude of the acceleration during a fall; 400 samples in 4 s. From left to right and top to bottom: F1, F2, F3, F4, F5, F6, F7 and F8. F3 shows a peak below g. In all the cases, the sensor is located on the lower back. (a) F1: backward fall, 3DACC g. (b) F2: forward fall, 3DACC g. (c) F3: forward fall, 3DACC g. (d) F4: forward fall, 3DACC g. (e) F5: forward fall, 3DACC g. (f) F6: backward fall, 3DACC g. (g) F7: backward fall, 3DACC g. (h) F8: unknown direction, 3DACC g.

