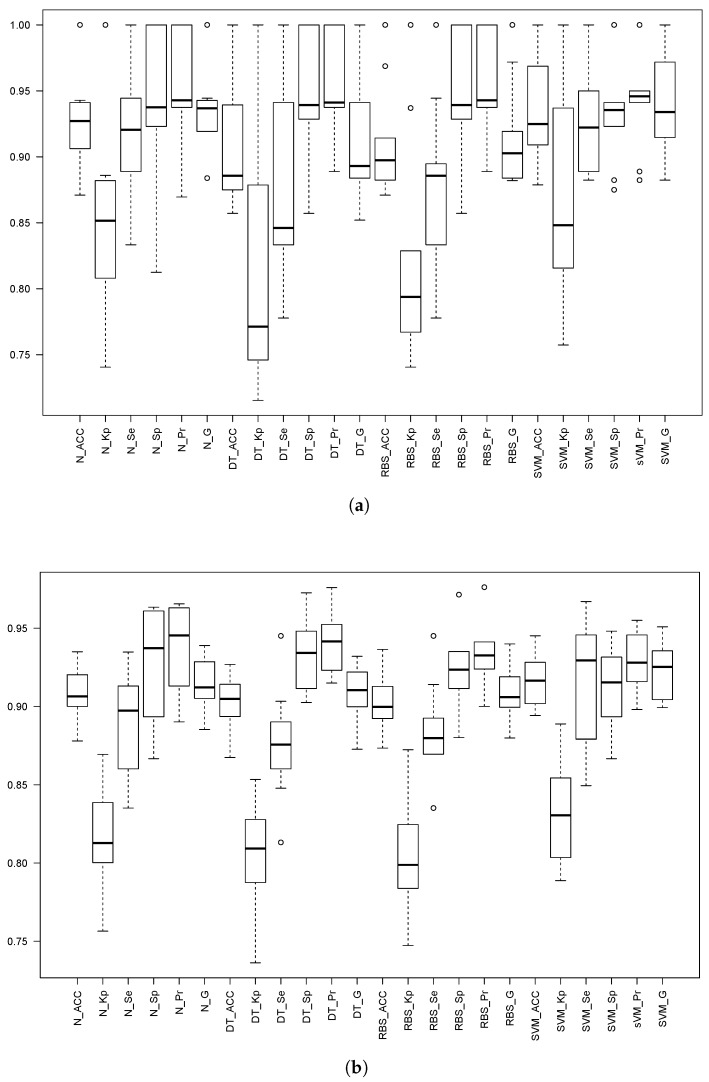
Figure 8.
Box plots of the different statistics for the three models when the threshold is set to g. The prefixes N_, SVM_, DT_ and RBS_ stand for the NN, SVM, Decision Trees C5.0 and Rule-Based System C5.0 models. The statistics are: Accuracy (Acc), Kappa factor (Kp), Sensitivity (Se), Specificity (Sp), Precision (Pr) and the Geometric mean (G), all of them computed using Equations (1) to (8). (a) Ten-fold cv; (b) 5 × 2 cv.

