Figure 8.

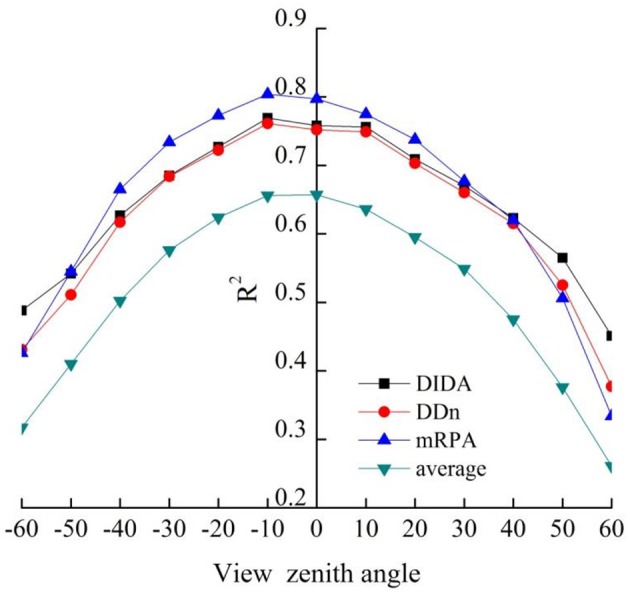
Relationship between aerial N uptake and DIDA, DDn, mRPA, and average (corresponding average value of 18 VIs at different VZAs, shown as average) at different VZAs (n = 155, p0.001 = 0.262).

Relationship between aerial N uptake and DIDA, DDn, mRPA, and average (corresponding average value of 18 VIs at different VZAs, shown as average) at different VZAs (n = 155, p0.001 = 0.262).