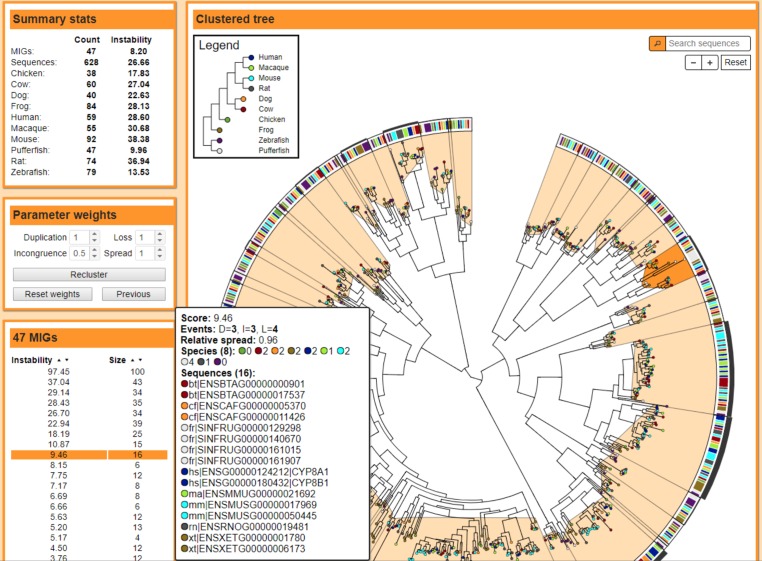
Figure 1. MIPhy results interface.
MIPhy visualization page for the 628 vertebrate Cyps from (Thomas, 2007). The MIGs are listed in the table on the left as well as indicated by the light orange shapes on the interior of the tree. The instability of each cluster is visualized by the bar charts around the outside of the tree. The colors of the band just inside of the circle match the colors of the tree nodes, and represent the originating species of each sequence.

