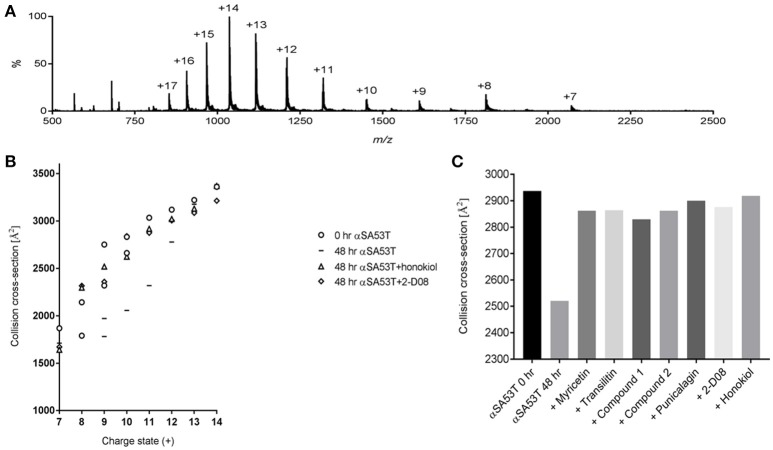
Figure 4.
(A) IM-MS spectrum of αSA53T (50 μM) in 50 mM ammonium acetate. (B) Plot of CCS vs. charge state for the dominant peaks in the IM-MS spectrum measured for αSA53T at 0 h (circles) and following incubation in the absence (squares) and presence of 1:2 (protein: compound) honokiol (triangles) or 2-D08 (diamonds). Where multiple features were observed in the ATD, CCS is plotted for each feature. (C) Experimentally derived CCSs for the +11-charge state (m/z 1,317) of αSA53T following 48 h incubation at 37°C with shaking at 300 rpm.

